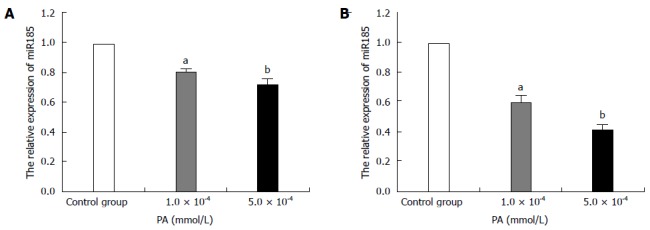
Figure 1.

MicroRNA-185 expression levels in palmitic acid-treated HepG2 cells. HepG2 cells were treated with 1.0 × 10⁻⁴ or 5.0 × 10⁻⁴ mmol/L PA; qRT-PCR detected microRNA-185 (miR-185) levels after 24-h (A) or 48-h (B) incubation. RNU6-2 was used as an internal control for miR-185. Data are mean ± SEM from three separate experiments. aP < 0.05, bP < 0.01 vs the normal control group. PA: Palmitic acid; qRT-PCR: Quantitative reverse transcription-polymerase chain reaction.
