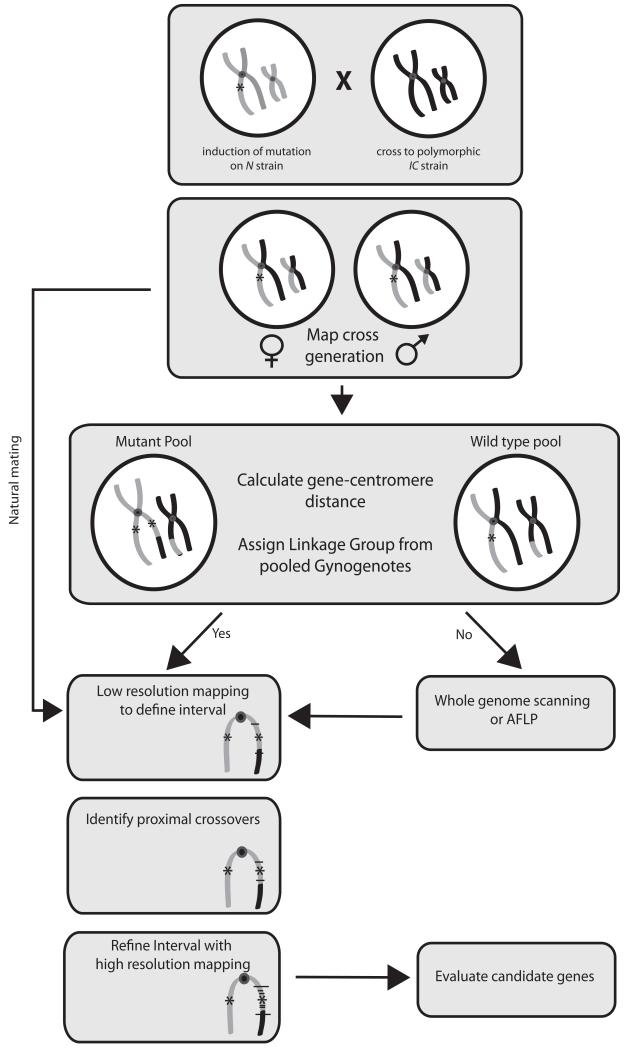
Figure 5. Flowchart for genetic mapping in X. tropicalis.
A recessive mutation induced on one strain (grey) is crossed to a polymorphic mapping strain (black) to obtain hybrid map cross carrier animals. Gynogenetic embryos are obtained from map cross females to calculate gene-centromere distance and for bulk segregant analysis with centromere markers to identify linked chromosome. Conventional crosses between map cross carriers are performed for subsequent analysis. If chromosomal linkage cannot be assigned by bulk segregant analysis, whole genome scanning with polymorphic markers, or Amplified Fragment Length Polymorphism (AFLP) analysis can be used. Low resolution mapping with a small number of mutant embryos is used to identify markers ~3-10cM apart flanking the mutation. These two flanking markers are then used to type large numbers (>500) of mutant embryos to identify those with crossover events between the flanking marker and the mutation. Small sets of recombinants can then be analysed with further markers to refine the interval and number of genes contained within it. Candidate genes are then evaluated by changes in gene expression, spatial expression of transcripts and cDNA sequence. Functional confirmation of any mutation found is accomplished by morpholino phenocopy and rescue with mRNA.

