
FIG. 3.
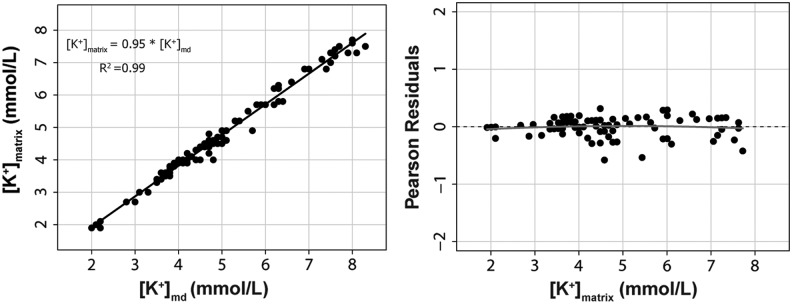
On the left, we represent the scatter plot matrix for K+ in the dialysate [K+]md and the predefined K+ concentration in the matrix [K+]matrix. The equation to calculate the [K+]matrix from the assayed concentration in the dialysate is also shown. R2=adjusted r-squared for the model. The right plot shows the Pearson's residuals (expected minus predicted values).