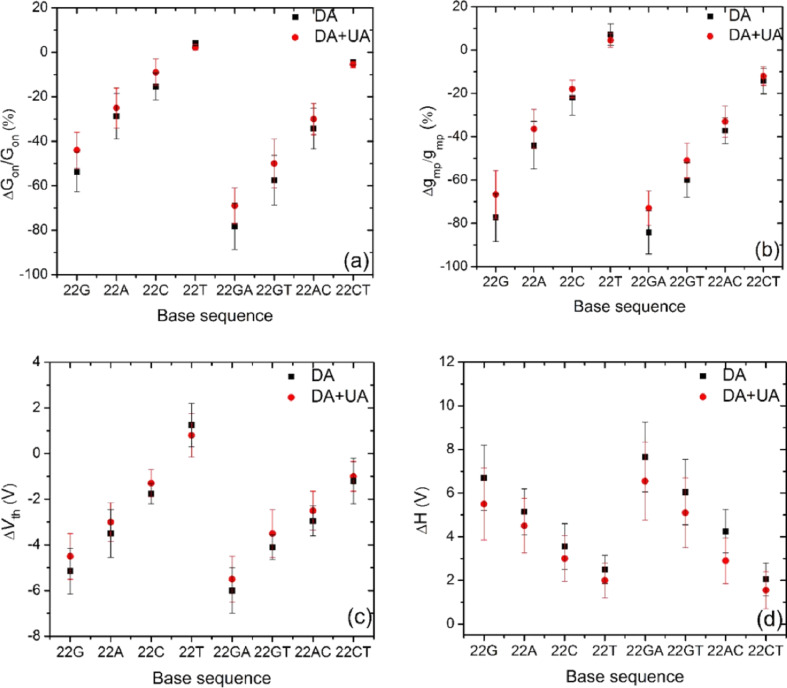
Figure 4.
Summary of the sequence-dependent variation in transistor electrical parameters induced by the DA and DA–UA solution mixtures. (a) ∆Gon/Gon, (b) ∆gmp/gmp, (c) ∆Vth, and (d) ∆H. The “−“ sign on the y-axis in (a) and (b) indicates the decrease in the respective parameters with respect to the ssDNA-functionalized state. The “−“ and “+” on the y-axis in (c) and (d) indicate the left shift in Vth and increase in H, respectively, with respect to the ssDNA functionalized state.

