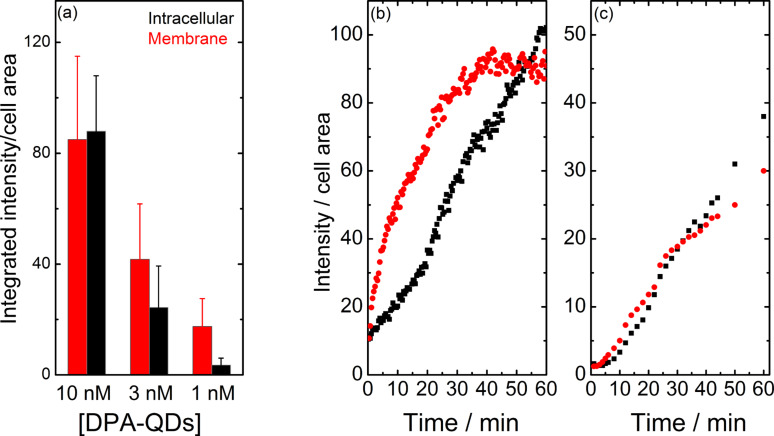
Figure 3.
(a) DPA-QD uptake within 1 h by live HeLa cells as a function of NP concentration. (b) DPA-QD and (c) AuNC accumulation in the intracellular (black symbols) and membrane (red) regions of live HeLa cells within the first 60 min. Cells were exposed to (a, b) 10 nM DPA-QDs and (c) 1 µM DHLA-AuNCs. Images in panels a and b were reproduced with permission from [31]. Copyright 2010 American Chemical Society; the image in panel c was reproduced with permission from [34]. Copyright 2013 Royal Society of Chemistry.

