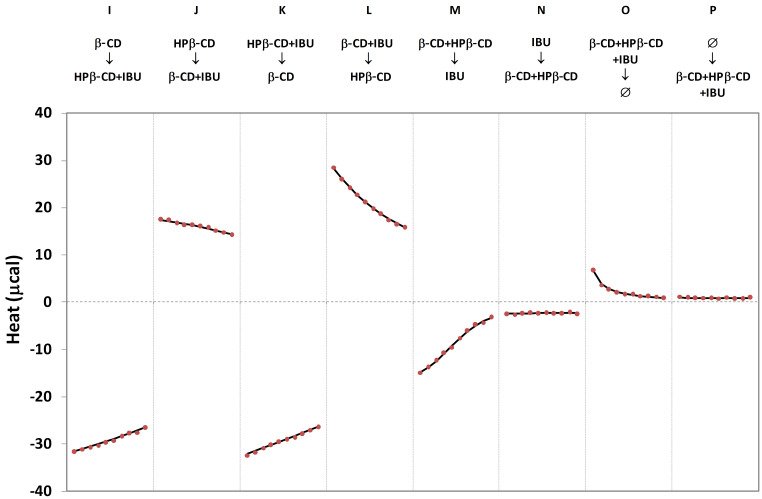
Figure 4.
Competitive ITC isotherms for the HPβ-CD-β-CD-IBU system at 283 K. Each protocol (from I to P) is defined by the respective content of syringe (top) and cell (bottom). Ø indicates the buffer solution. Lines and dots correspond to theoretical and experimental data, respectively. The x axis corresponds to the injection number (10 injections per isotherm).

