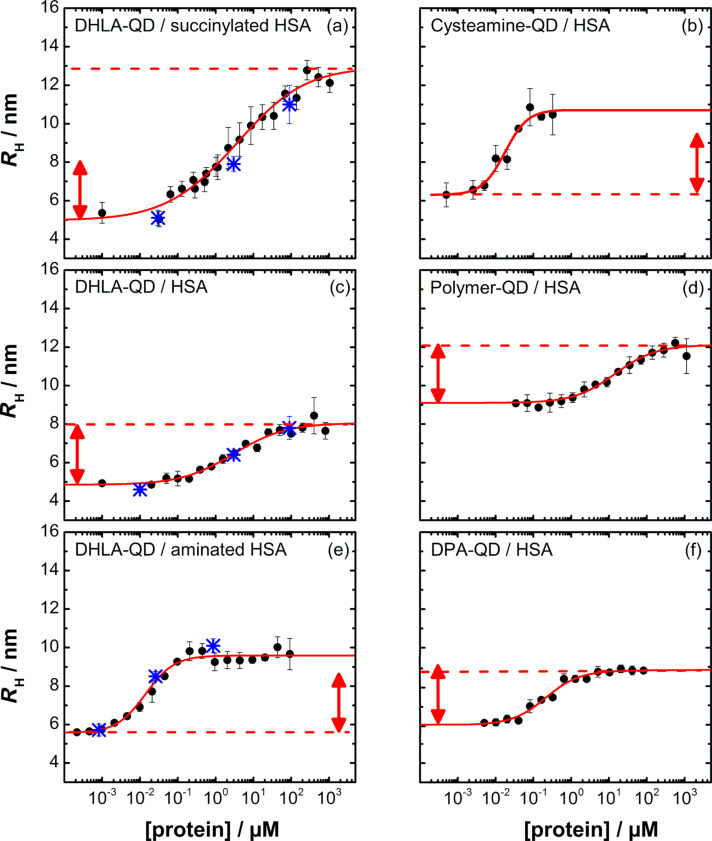
Figure 3.
Hydrodynamic radii, RH, of differently functionalized CdSe/ZnS QDs as a function of the concentration of proteins freely diffusing in solution. Details of the NPs and proteins are given in the individual panels. Data (black circles) were fitted with the model given by Equation 1 and Equation 2 (lines); best-fit parameters are compiled in Table 2. Data in a), c), and e) taken from [22] are included for comparison; blue stars represent RH values from controlled desorption experiments. Red arrows with a length corresponding to 3.2 nm are included in each panel to visualize deviations from this value.

