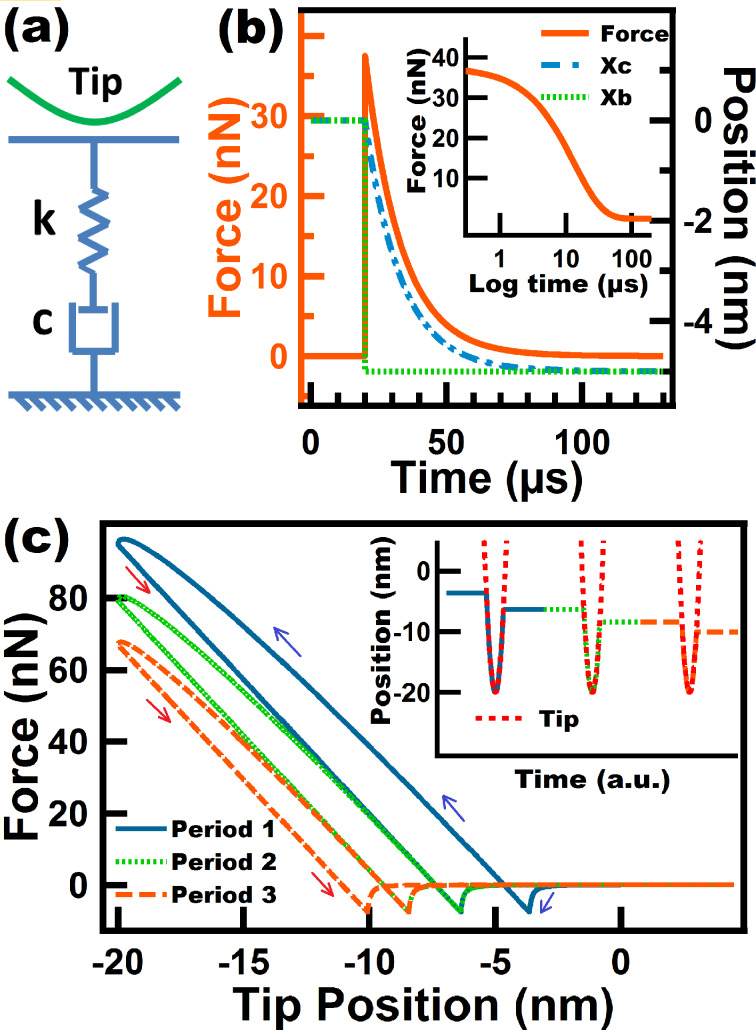
Figure 1.
(a) Linear Maxwell model schematic; (b) stress relaxation simulation performed on a Linear Maxwell surface. The surface position (Xb) is depressed to a constant position of 5 nm below its unperturbed state, starting at t = 20 µs. The inset shows the same stress relaxation experiment but starting at t = 0 µs, and the horizontal axis is intentionally plotted by using a logarithmic scale to show the inflection point corresponding to its single relaxation time. (c) Force–distance tip trajectories (the trajectory proceeds in the counterclockwise direction) for a prescribed sinusoidal tip trajectory given by z(t) = 80 nm + (100 nm) sin(ωt), where ω is 2π times 25 kHz. The inset shows three consecutive tip–sample taps, each one separated by a fundamental period equal to 1/25 ms. The Linear Maxwell parameters used were k = 7.5 N/m and c = 1.0 × 10⁻⁴ N·s/m. The blue and red arrows in (c) correspond to approach and retraction of the tip, respectively.

