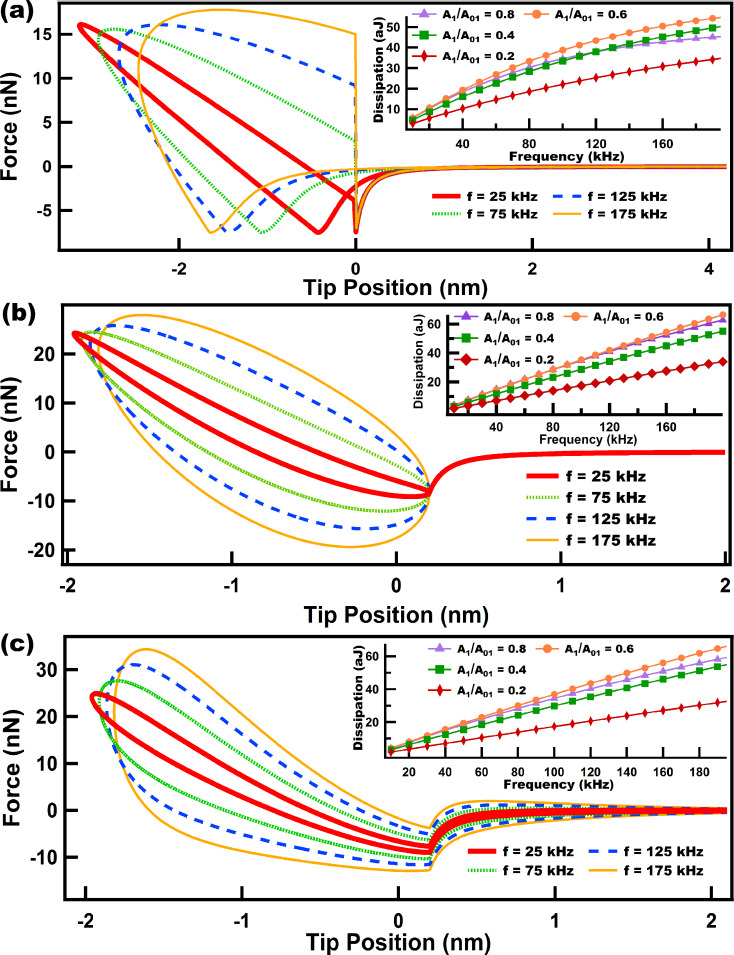
Figure 6.
(a), (b) and (c) show force trajectories for a tip following a numerically simulated (not prescribed) single tapping mode trajectory over a Linear Kelvin–Voigt, a DMT-García, and a DMT-Gotsmann sample, respectively. Each of the force trajectories is color-coded according to the cantilever eigenfrequency used in the simulation. The insets in the figures show the behavior of dissipation as the frequency increases, and each color coded line relates to a specific amplitude setpoint (A1/A01). The simulation parameters for the cantilever dynamics in (a), (b) and (c) are: cantilever position zc = 80 nm, free amplitude (A01) = 100 nm, cantilever stiffness (km1) = 4 N/m. The Linear Kelvin–Voigt parameters for (a) were k = 7.5 N/m and c = 1.0 × 10⁻⁶ N·s/m. The sample parameters for (b) and (c) are the same as for Figure 4.

