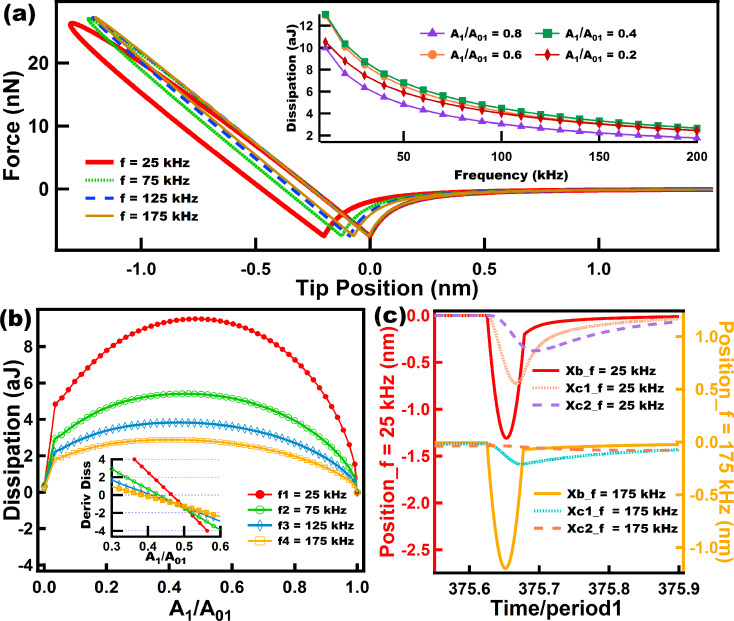
Figure 7.
Results of energy dissipation when a numerically simulated tip trajectory in intermittent contact AFM interacts with a Nafion model. (a) shows force–distance curves for tips driven at different eigenfrequencies (color coded). The inset in (a) shows the behavior of the dissipation as the frequency grows, and each color-coded line relates to a specific amplitude setpoint (A1/A01). (b) shows dissipation vs amplitude setpoint (A1/A01) curves in which each color-coded line corresponds to a specific eigenfrequency. The inset in (b) shows the slope of the curves in (b) near the range where the slopes cross the x-axis in order to easily locate the maxima of the curves in (b). (c) shows the response of the surface and dashpots of the Nafion model for two cases at different cantilever eigenfrequencies. The parameters for the cantilever dynamics are the same as in Figure 6. The sample parameters use were: ke = 20 N/m, k1 = 10 N/m, k2 = 5 N/m, and c1 = c2 = 1.0 × 10⁻⁵ N·s/m. Time normalization has been carried out in (c) with respect to the fundamental period for ease of comparison.

