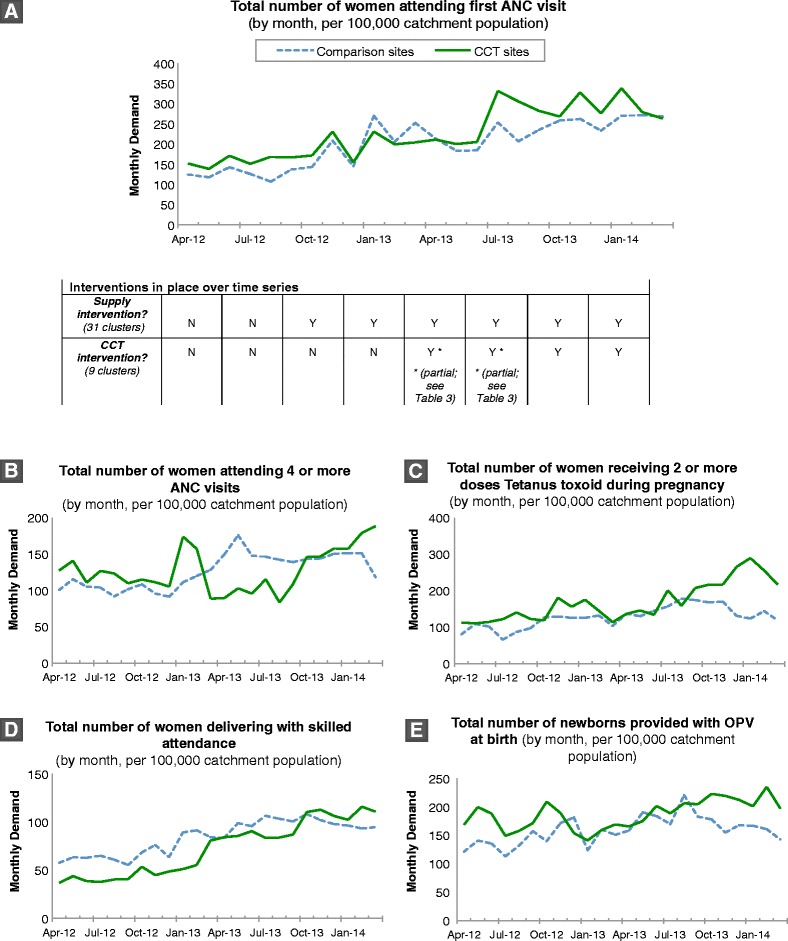
Figure 5.

Time series plot of monthly service uptake for key services, in states piloting CCT programme. Trends in service use at 31 clusters in nine states piloting the SURE-P Conditional Cash Transfer (CCT), shown as monthly totals standardised per 100,000 catchment population from 2012–2014. The trends are shown separately for the nine clusters implementing the CCT and 22 comparison clusters. A) Total attendance for first antenatal care visit; B) Total number of pregnant women attending four or more ANC visits; C) Total number of women receiving two or more doses Tetanus toxoid during pregnancy. D) Total number of women delivering with skilled attendance; E) Total number of newborns provided with zero-dose OPV. Abbreviations: ANC, Antenatal care; OPV, Oral polio vaccine.
