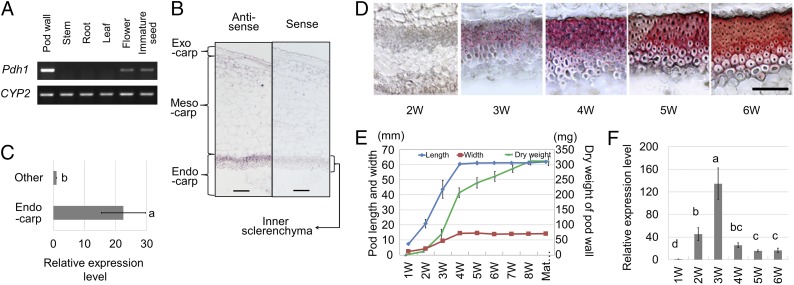
Fig. 3.
Cultivated soybean [Glycine max Merr. (L.)] Pdh1 expression patterns. (Scale bars: 100 μm.) (A) Results of RT-PCR targeting Pdh1 transcripts in several tissues. CYP2 corresponds to cyclophilin 2, used as a reference. (B) In situ hybridization for Pdh1 with an RNA probe in the antisense direction (Anti-sense) and with the probe in the sense direction (Sense) to detect nonspecific binding. (C) Relative expression levels of Pdh1 in the endocarp and the remaining portion of 5-wk-old pod walls detected by quantitative RT-PCR with reference to CYP2. (D) Cross-sections of inner parenchyma of 2- to 6-wk-old pod walls stained with phloroglucinol-HCl to reveal the degree of lignification. (Scale bar: 100 μm.) (E) Changes in pod length, pod width, and pod-wall dry weight during pod growth. (F) Relative expression levels of Pdh1 in 1- to 6-wk-old pod walls (means ± SE; n = 3). Different letters indicate significant differences (P < 0.05) between tissues (C) or among stages (F). 1W–8W correspond to the number of weeks after anthesis. Mat indicates maturity.

