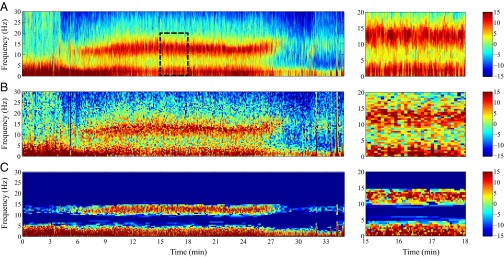
Fig. 4.

Spectral estimates of real EEG data from a subject undergoing propofol-induced general anesthesia. (A) Multitaper with 2-s temporal resolution, (B) multitaper with 0.5-Hz frequency resolution, and (C) robust spectral estimate. (Right) Respective zoomed-in views from to . The color scale is in decibels.
