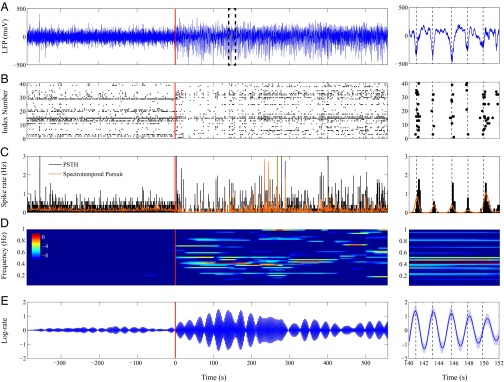
Fig. 5.

Spectral decomposition of the neural spiking activity from a subject undergoing propofol-induced general anesthesia. (A) LFP activity, (B) raster plot of the spike trains from the 41 units that were simultaneously acquired alongside the LFP activity, (C) PSTH and robust estimate of the firing rate obtained using spectrotemporal pursuit, (D) spectral decomposition of the firing rate in the -Hz band (color scale in decibels), and (E) -Hz component of log-firing rate (dark blue) with 95% confidence bounds (shaded region). (Right) Respective zoomed-in views from to . The transition into LOC is marked by the onset of a strong -Hz oscillation.
