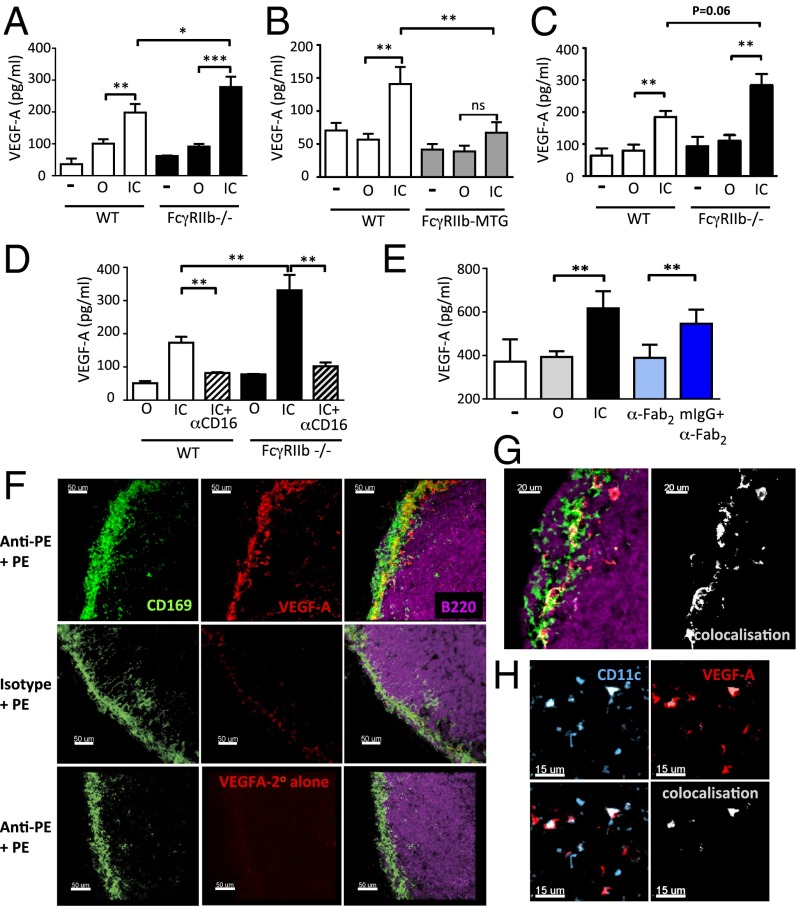
Fig. 1.
IgG immune complex-induced VEGF-A production by macrophages and DCs is inhibited by FcγRIIb. VEGF-A concentration in culture supernatants following 24-h incubation with media alone (−), ovalbumin (O), or IgG-opsonized ovalbumin (IC) using (A) peritoneal macrophages from WT and Fcgr2b−/− mice, (B) peritoneal macrophages from nontransgenic (NTG) and FcγRIIb-MTG mice, and (C) bone-marrow–derived DCs from WT and Fcgr2b−/− mice. (D) VEGF-A concentration in culture supernatants of murine macrophages stimulated with O, OVA-IC, and isotype (IC), or OVA-IC and anti-CD16 (FcγRIII) antibody (IC+αCD16). (E) VEGF-A production by unstimulated (US) bone-marrow–derived macrophages or those stimulated with O, IC, anti-mouse F(ab′)2,(αFab2), or anti-mouse F(ab′)2/mouse IgG immune complexes (mIgG+αFab2). Graphs show the mean and SE of mean. P values calculated using a Student's t test. Graphs show representative experiments from three to five repeats. (F) Confocal micrograph of inguinal lymph node section obtained from WT mice following passive immunization with an anti-PE antibody or isotype control, followed by s.c. PE. Lymph nodes harvested at 24 h and stained for CD169 (green), VEGF-A (red), and B220 (purple). (Lower) Secondary antibody alone for VEGF-A. Images representative of three lymph node sections. (G) High power image showing extent of colocalization of CD169 and VEGF-A. (H) Confocal image of lymph node stained with CD11c antibody (blue) and VEGF-A (red). Colocalization is shown in white.

