Fig. 1.
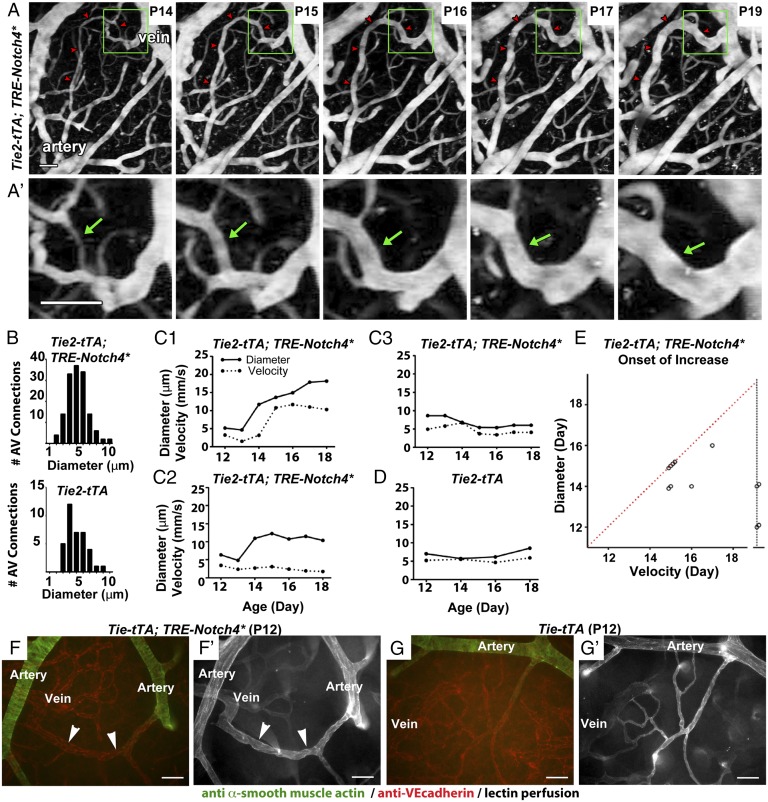
Tie2-tTA;TRE-Notch4* mice developed AV shunts through enlargement of capillary-like vessels. (A and A′) Two-photon time-lapse imaging of FITC-dextran–labeled AV connections in the cerebral cortex through a cranial window. An AV shunt (red arrowheads and green arrows) developing from a capillary-diameter AV connection between P14 and P19. (B) Distribution of initial AV connection diameter (smallest lumen diameter) in AV connections in mutants (109 AV connections in 12 mice) and controls (36 AV connections in 5 mice, ages P8–P11). (C and D) Blood velocities (dotted lines) and lumen diameters (solid lines) measured over time in the capillary-like AV connections of (C1–C3) Notch4* mice and (D) controls. (E) Time of initial velocity increase vs. time of initial diameter increase for individual AV connections. Dotted red line represents simultaneous increase of blood velocity and vessel diameter. Points on the dotted vertical black line represent capillary-like vessels that enlarged but did not exhibit a significant increase in velocity. Increased velocity and diameter were defined by changes >2× the SD in control capillaries: 0.82 mm/s for velocity and 1.33 μm for diameter. (F and G) Whole-mount immunostaining of P12 surface cerebral cortex vasculature for α-smooth muscle actin (green) and VE-cadherin (red) in mutant (F) and control (G). Arrowheads indicate AV shunt (18 AV shunts in seven mice); corresponding lectin perfused vessels are shown (F′ and G′). (Scale bars, 50 μm.)

