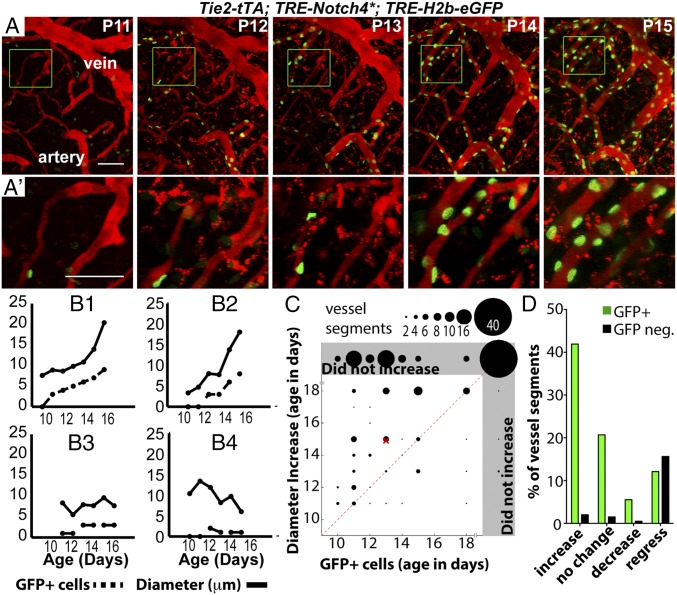
Fig. 2.
Notch4 expression increased in brain capillaries before enlargement of AV shunts. (A and A′) Two-photon imaging of an AV connection from P11 to P16; Texas-Red–dextran labels plasma (red) and TRE-H2b-eGFP indicates tTA activity (green). (B1–B4) Diameter vs. number of GFP+ cells in vessel segments: increased (B1 and B2), stable (B3), and decreased (B4) diameter. (C) Correlation between time of initial detection of GFP+ cells and initial diameter increase in capillary-diameter vessel segments of Notch4* mice. Gray regions indicate that GFP+ cells were not detected or diameter increase was not detected or both. Dotted line represents simultaneous detection of GFP+ cells and diameter increase. The “×” indicates the means. GFP was detected before (125/198 vessel segments, five mice), or simultaneous with enlargement (19/198) in most cases. (D) Percentage of vessel segments (TRE-eGFP+ or negative) that demonstrated an increase, decrease, or no change in diameter or that completely regressed. Increased or decreased diameter is defined by >2× the SD of change in control vessels (1.1 μm) in the same period; segments are defined by branch points. (Scale bars: A, 100 µm; C, 50 µm.)

