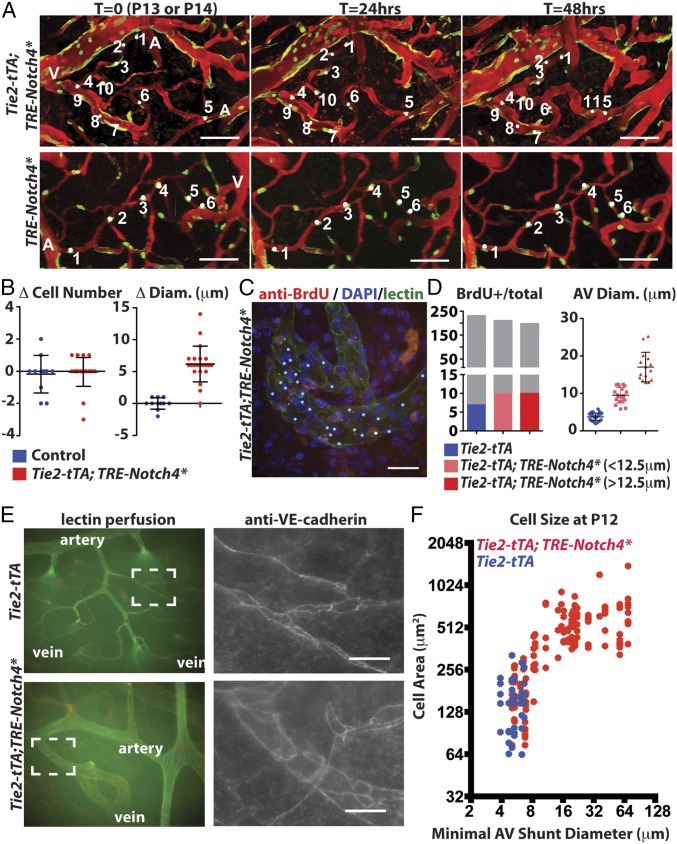
Fig. 3.
Endothelial growth in the AV shunt accompanied by the expansion of endothelial cell surface area. (A) Two-photon time-lapse imaging showing Cdh5(PAC)-CreER; Confetti-marked nuclear GFP+ and cytoplasmic YFP+ ECs in cerebral cortex of mutants and controls. Texas-Red–dextran labels plasma. (B) Quantification of total cell number and AV connection diameter over the same interval (22 AV connections in five mutants, 11 AV connections in three controls). (C) Whole-mount BrdU staining/lectin perfusion. P12 AV connection from mutant cerebral cortex is shown. Blue dots indicate Hoechst+/lectin+ cells. White dots indicate BrdU+/lectin+ cells. (D) Quantification of BrdU+ ECs, total ECs, and AV connection diameter (34 connections in controls, 20 AV connections <12.5 µm in five mutants, and 15 AV connections ≥12.5 µm in four mutants). Gray indicates all Hoechst+/lectin+ cells, and the colored portion indicates the number of BrdU+/lectin+ cells. (E) Whole-mount staining of P12 cerebral cortex for VE-cadherin, counterstained by lectin perfusion. (F) Correlation of size of VE-cadherin–traced cells in P12 control (blue) and Notch4* (red) connections with AV connection diameter (24 AV connections in 11 mutants, 6 AV connections in three controls). (Scale bars: A, 100 µm; C and E, 25 µm.)

