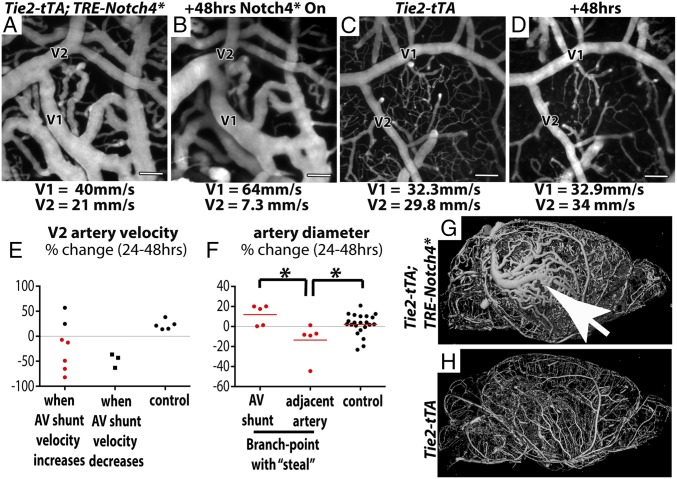
Fig. 5.
AV shunts with higher velocity enlarged whereas adjacent arteries with lower velocity reduced in caliber. (A–D) Two-photon time-lapse imaging of FITC-dextran–labeled blood vessels on cerebral cortex through a cranial window. Average blood velocity, as determined by line-scan analysis of single RBCs is indicated for the AV shunt (V1) and the adjacent artery (V2) in a mutant (A and B) and control (C and D). (E) Change in velocity over 24–48 h in distal arteries from Notch4* AV shunts when shunt velocity increased (n = 7) or decreased (n = 3), and in the smaller artery of similar branch points in controls (n = 5). (F) Change in diameter of AV shunts and adjacent arteries in the subgroup of Notch4* mice in which AV shunt velocity increased and distal velocity decreased (red points in E). (G and H) MicroCT of microfil-labeled whole-brain vasculature in (G) Notch4* and (H) control mice. Arrow indicates focal aggregation of enlarged arteries and veins. *P < 0.05. (Scale bars, 100 μm.)

