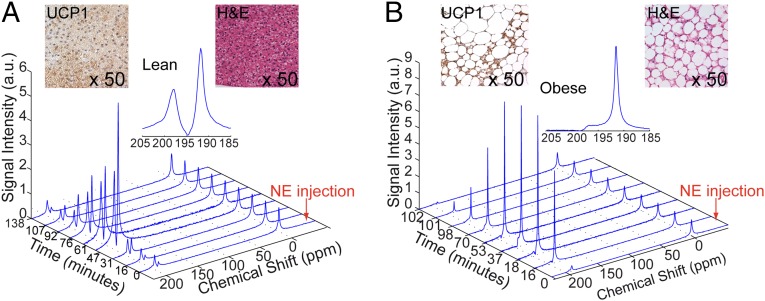
Fig. 1.
Enhancement of xenon uptake in BAT upon stimulation of thermogenesis. Temporal dynamics of hyperpolarized 129Xe resonances as acquired in a lean (A) and in an obese (B) animal before and during NE stimulated thermogenesis. All spectra are normalized to the gas-phase peak. (Inset) Hyperpolarized xenon spectra acquired after the injection of NE show two predominant peaks, one at 190 ppm corresponding to lipid-dissolved xenon and one at 198 ppm, corresponding to xenon dissolved in the cell cytoplasm. Inset also shows H&E-stained slides and UCP1 stained slides of BAT in the two mice. The H&E slides show larger lipid droplets (white) and a higher fat content in the obese mouse BAT. UCP1 stained slides of BAT show the presence of UCP1 (brown color) in both phenotypes, although UCP1 content is considerably reduced in the BAT of obese mice.

