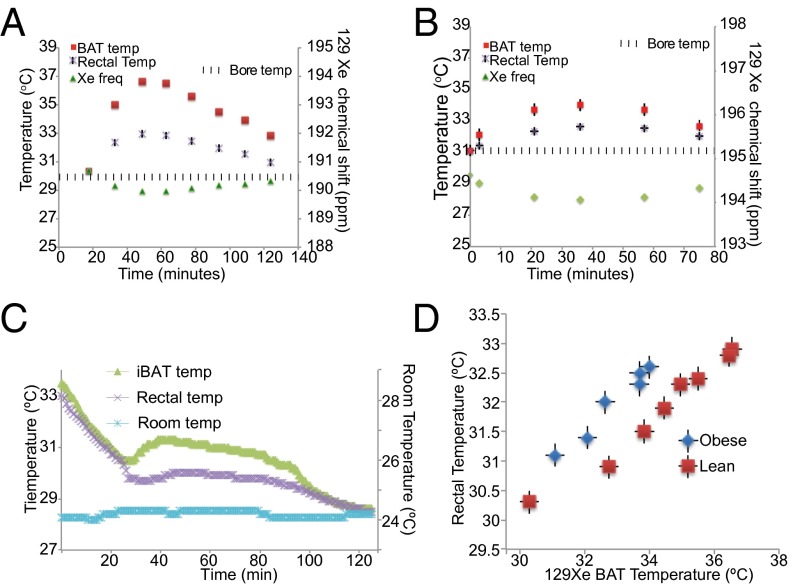
Fig. 5.
Detection of BAT thermogenic activity. BAT temperature as a function of time after stimulation of BAT thermogenesis in a lean (A) and in an obese (B) animal as measured by the frequency shift of the lipid-dissolved xenon peak. The graph also shows the corresponding increase in BAT rectal temperature as detected by an MR-compatible rectal probe. Similar temperature behavior is seen using temperature probes inserted below the BAT in a lean phenotype (C). (D) BAT temperature, as measured by the lipid-dissolved xenon resonance frequency shift, as a function of mouse rectal temperature. BAT temperature does not correlate well with rectal temperature as BAT temperature; during thermogenic activity it is expected to be higher than rectal temperature.

