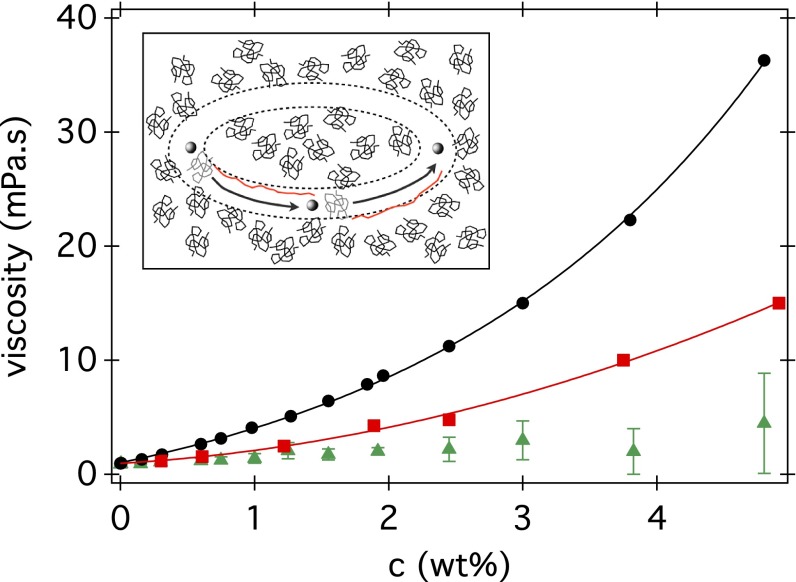
Fig. 6.
Viscosities of PVP360k solutions: low-shear values from rheometry (filled circle); microrheology data obtained using 980-nm beads at 104 Hz (red square); and deduced from swimming data (green triangle). Lines are best fits (SI Text). (Inset) Schematic showing three snapshots of a section of a flagellum (sphere, ) cutting through a solution of polymer coils () (with a circular path). Coils, which are initially in the path of the flagellum section (gray), become stretched out (red), leaving a coil-sized channel of solvent.

