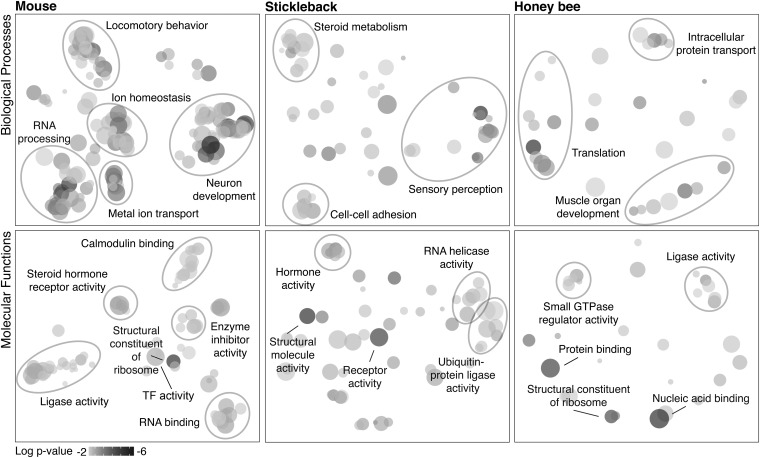
Fig. 1.
Major biological processes (Top) and molecular functions (Bottom) regulated in response to territory intrusion for each species as revealed by Gene Ontology analysis of genes differentially expressed in the brain in response to social challenge. Clustering analyses of single-species GSEA results (adjusted P value < 0.05) are shown. Shading of circles indicates relative significance of the GO term (darker is more significant). Circle size corresponds to the number of genes annotated to the term in the reference database. See Datasets S1–S3 for full lists.

