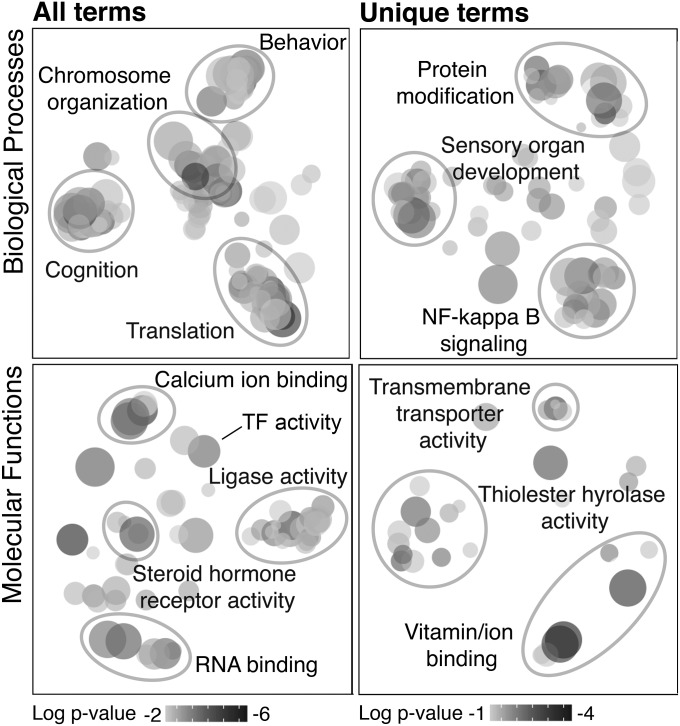
Fig. 2.
Clustering analyses for the homologous triplet GSEA (adjusted P value < 0.05). Triplets were groups of orthologous or paralogous genes as identified by OrthoDB. (Left) Clustering analyses include all significant terms. (Right) Analyses include only terms unique to the homologous triplet GSEA (not identified in any of the single-species analyses). See Dataset S5 for full list.

