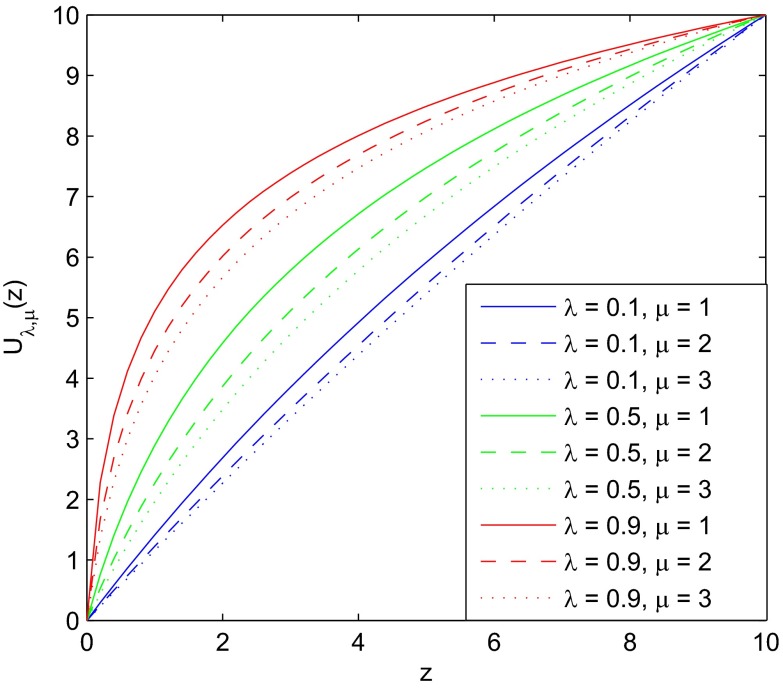
Fig. 1.
Utility functions implied by environments with different portions of systematic risk and different levels of idiosyncratic risk: represents a low level of systematic risk, represents a high level of systematic risk, represents a low level of idiosyncratic risk, and represents a high level of idiosyncratic risk. All nine utility functions are normalized by setting and .

