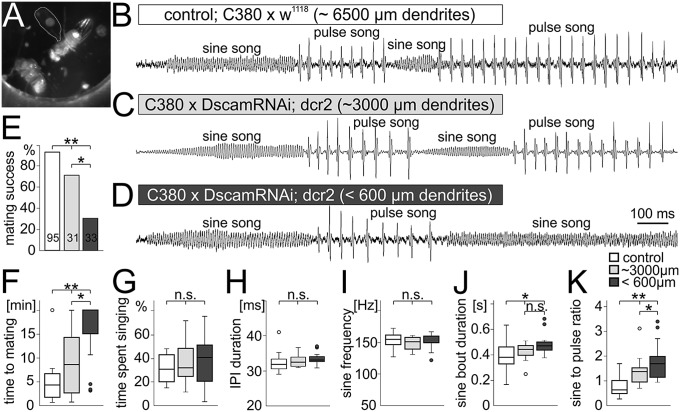
Fig. 4.
Song quality and mating success scale with the severity of dendritic defects. (A–C) During courtship song the male fly orients toward the female, spreads out one wing (A), and produces two distinctly different song elements by up and down wing movements. (B) Sound patterns with low amplitude and an average frequency of 155 ± 10 Hz are named sine song, whereas high-amplitude sound pulses with an average IPI of 33 ± 3 ms are named pulse song. (C) Animals with a 50% reduction in wing depressor motoneuron dendrites produce normal sine and pulse song elements. (D) Even with 90% dendrite reduction sine and pulse song frequencies and amplitudes are similar to controls. (E) However, mating success within 20 min decreases from 96% in controls (white), over 64% with 50% dendrite reduction (light gray) to 21% with 90% dendrite reduction (dark gray). Thus, mating failure rates scale with the dendritic defect severity. (F) Similarly, the time to mating increases significantly with the dendritic defect severity. (G) However, all three groups spend the same amounts of time singing. (H and I) IPI (H) and sine song frequency (I) are statistically identical in all groups. (J) The average sine bout duration is significantly increased in animals with Dscam1 RNAi expression. (K) Summing up all sine and pulse song bouts reveals a statistically significant increase of the sine to pulse song ratio with 50% dendrite reduction compared with controls. In animals with 90% reduction of wing motoneuron dendrites the sine to pulse song ratio is significantly further increased (Kruskal Wallis ANOVA with post hoc U tests).

