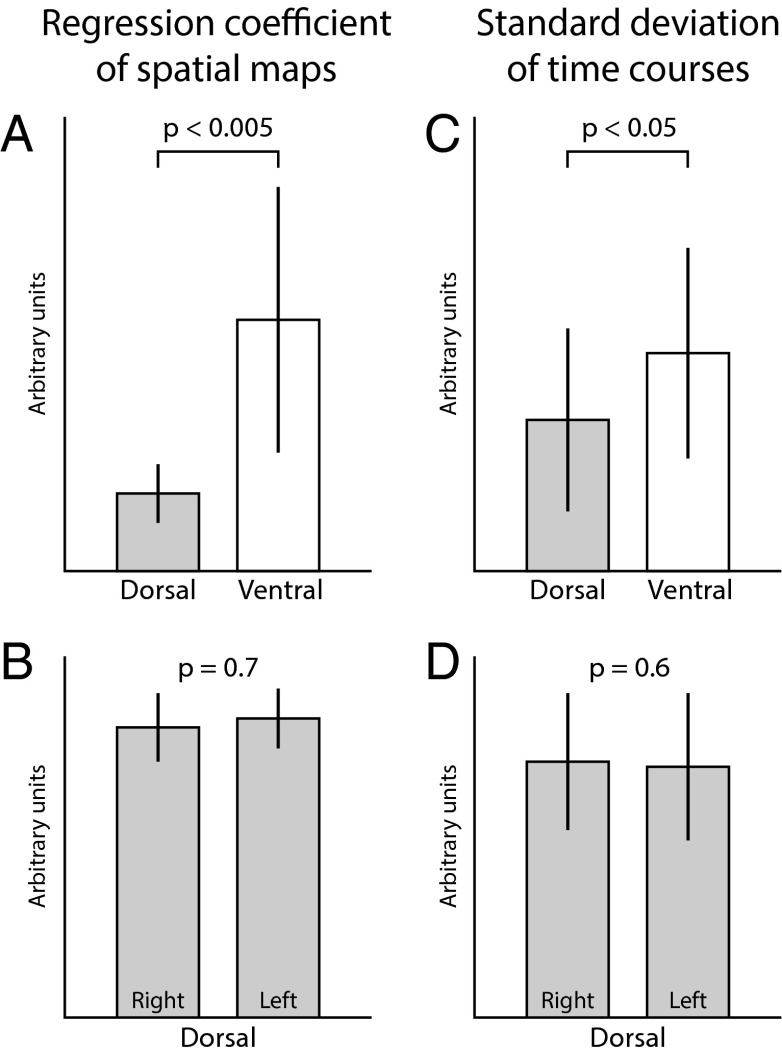
Fig. 3.
Intrinsic properties of visually identified RSNs. Depicted are comparisons of the spatial map regression coefficients (representing the degree of coactivation) and the component time series SD (representing the component strength). We observed significant differences for both metrics between dorsal and ventral RSNs (A and C), but not between left and right dorsal RSNs (B and D); note that the laterality analysis could not be done for ventral RSNs as these were predominantly bilateral. Error bars represent standard deviation.

