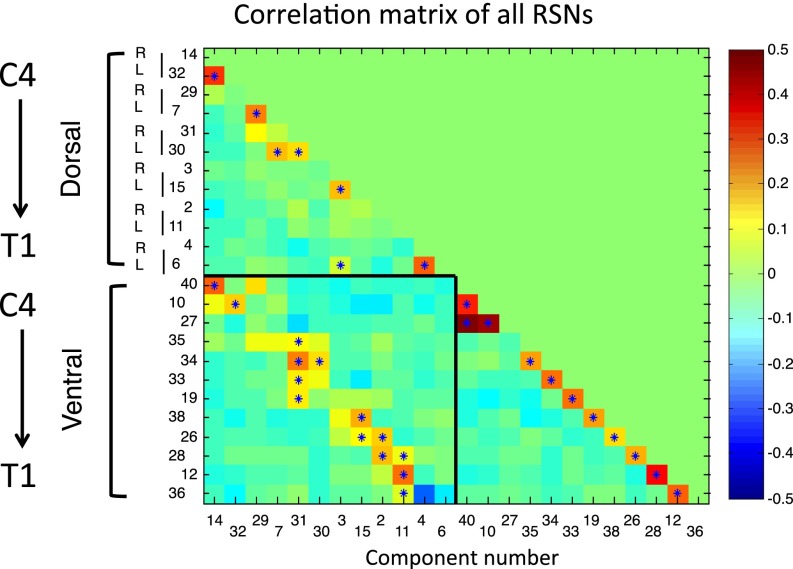
Fig. 4.
RSN correlation matrix. This correlation matrix contains the full correlations between the time-courses of all visually identified dorsal and ventral components (see SI Appendix, Fig. S9 for partial correlations). Components were arranged in rostro-caudal anatomical order, similar to Figs. 1 and 2. For both dorsal and ventral RSNs, components are positively correlated at the same rostro-caudal level, but not correlated or even slightly negatively correlated to other levels. Interestingly, dorsal and ventral networks of the same level are positively correlated (box in lower left corner; except for T1 – component 4 and 36). Asterisks indicate correlations significant at P < 0.05 (FWE corrected using nonparametric permutation testing). Note that component ordering is based on the amount of variance each component explains (in decreasing order).

