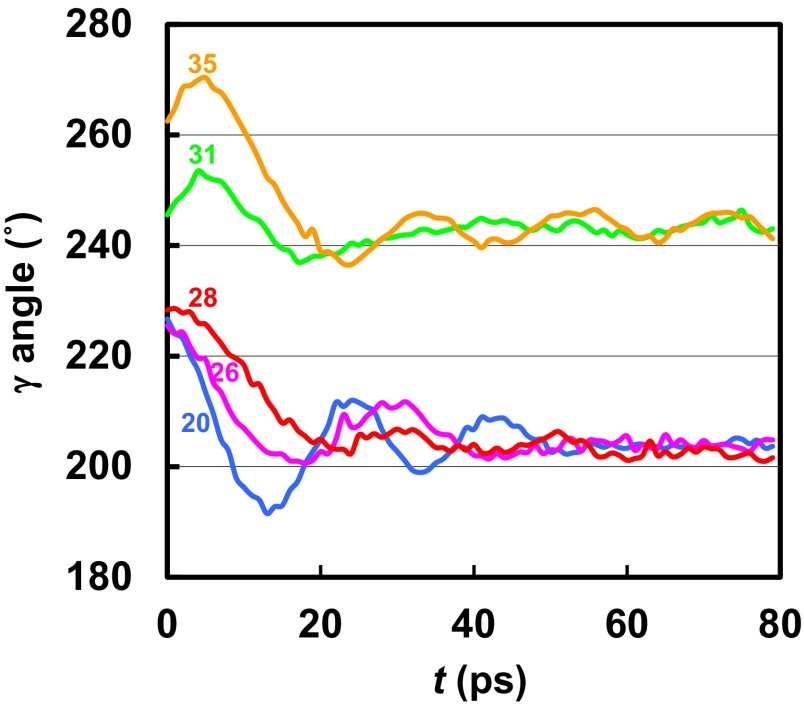
Fig. 2.
Rotational angle of the γ-subunit as a function of time during the relaxation simulations (see text) for different B^C angle values of the βDP subunit after the simulations with the applied torque. The values of the B^C angle in the βDP subunit are shown for each trajectory to indicate the stage of binding cleft opening during the transition from the βDP (B^C = 21.6°) to the βE (B^C = 48.6°) conformation. The B^C angles were maintained at their initial values by the PNM restraining potentials during the simulations.

