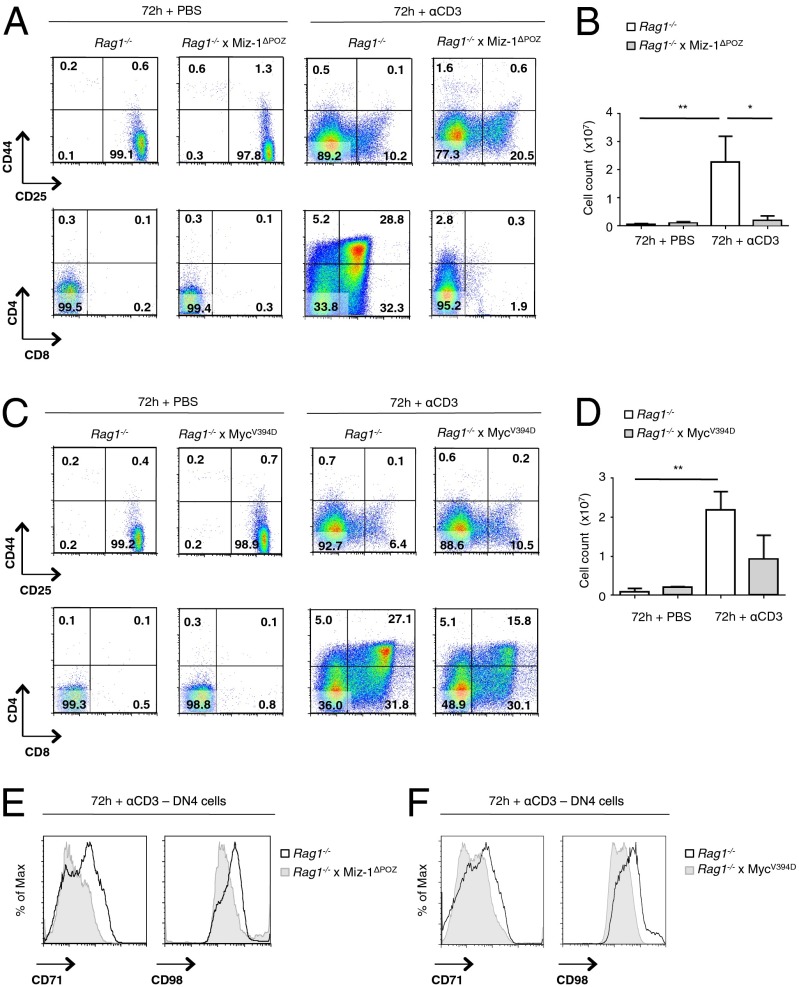
Fig. 5.
Mitogenic stimulation of Rag1−/−, Rag1−/− × Miz-1ΔPOZ, and Rag1−/− × MycV394D KI pre-T cells. (A) FACS analysis of Rag1−/− and Rag1−/− × Miz-1ΔPOZ mice at 72 h after injection with PBS or αCD3 antibodies. FACS plots are a representative example of three independent experiments. (B) Absolute cell counts of total thymocytes from A. Data are averaged from three independent experiments and are presented as mean ± SD. (C) FACS analysis of Rag1−/− and Rag1−/− × MycV394D KI mice at 72 h after injection with PBS or αCD3. FACS plots are a representative example of three independent experiments. (D) Absolute cell counts of total thymocytes from B. Data are averaged from three independent experiments and are presented as mean ± SD. (E) FACS analysis of CD71 and CD98 on Rag1−/− and Rag1−/− × Miz-1ΔPOZ thymocytes at 72 h after injection with αCD3. FACS plots are a representative example of three independent experiments. (F) FACS analysis of CD71 and CD98 on Rag1−/− and Rag1−/− × MycV394D thymocytes at 72 h after injection with αCD3. FACS plots are a representative example of two independent experiments.

