Fig. 8.
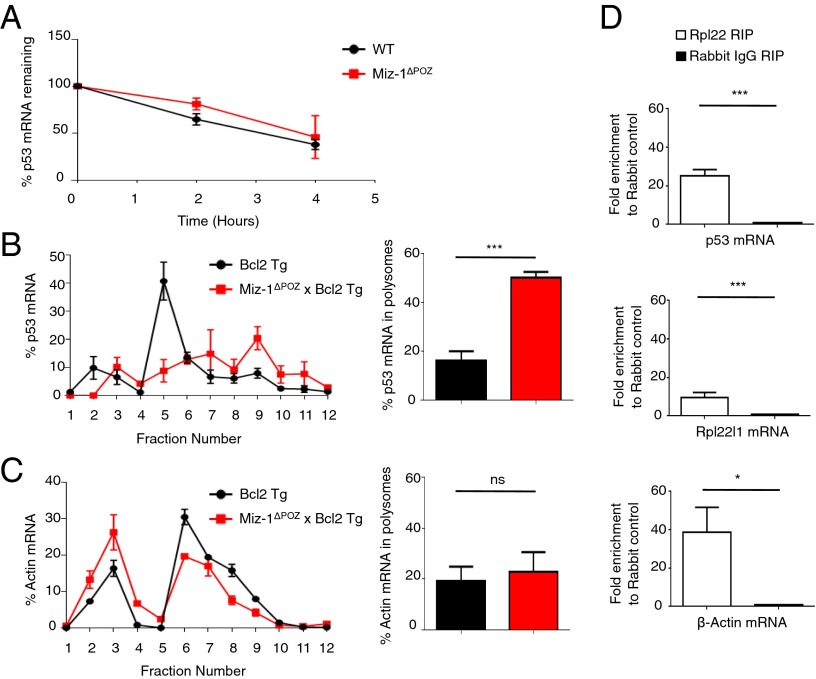
Rpl22 regulates the translation of p53. (A) Sorted DN3 cells from WT or Miz-1ΔPOZ mice were treated with 5 μg/mL actinomycin D and harvested at the indicated time points. The percentage of p53 mRNA remaining at each time point was assessed by RT-qPCR and normalized to Gapdh. Data are averaged from three independent experiments and are presented as mean ± SD. (B) (Left) Total thymic extracts from Bcl2 Tg and Miz-1ΔPOZ × Bcl2 Tg mice were sedimented through a sucrose gradient and fractionated. qRT-PCR was performed to measure p53 mRNA in the fractions collected. Data are presented as the percentage of p53 mRNA in each fraction. The graph is representative of three independent experiments. (Right) Quantification of the percentage of p53 mRNA in polysomes (fractions 8–12) from left. Data are averaged from three independent experiments and are presented as mean ± SD. (C) (Left) Total thymic extracts from Bcl2 Tg and Miz-1ΔPOZ × Bcl2 Tg mice were sedimented on a sucrose gradient and fractionated. qRT-PCR was performed for β-actin on the fractions collected. Data are presented as the percentage of β-actin mRNA in each fraction. The graph is representative of three independent experiments. (Right) Quantification of percentage of β-actin mRNA in polysomes (fractions 8–12) from the left panel. Data are averaged from three independent experiments and are presented as mean ± SD. (D) RNA-IP of Rpl22 in P6D4 pre-T cells. The graph shows fold enrichment of anti-Rpl22 RIP over rabbit IgG control RIP. Rpl22l1 mRNA served as a positive control for Rpl22 RIP. β-actin mRNA is also enriched in anti-Rpl22 RIP. Data represent average fold change ± SD from three independent experiments.

