Fig. 1.
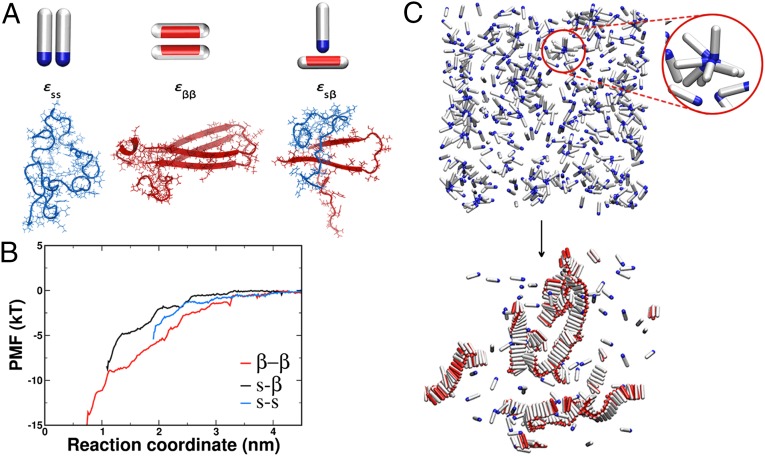
Possible interactions in the system. (A, Left) Two spherocylinders representing the soluble peptides interact through their attractive tips (blue). The interaction strength is given by . (A, Center) Spherocylinders in the β-form interact through their side patches (red). The strength of this interaction is . (A, Right) The interaction between the soluble peptide and the β-competent form is given by . Underneath each coarse-grained representation is its atomistic realization for the case of the Aβ1–42 peptide. Snapshots are taken at the shortest distance of the molecular dynamics umbrella sampling at 10 ns. (B) Potential of mean force (PMF) for the pair interactions in the Aβ1–42 system used to guide coarse-grained simulations. The red curve represents the interaction between two peptides in the β-form, the blue curve is the interaction between the random coil peptides, whereas the black line is the interaction between the random coil peptide and the peptide kept in the β-prone form. (C) Representative snapshots before the nucleation occurred and at the end of the simulation run. (Upper) Disordered oligomers formed by peptides in their soluble form. The red circle magnifies such an oligomer. (Lower) Amyloid-like fibrils formed by peptides in the β-sheet–competent form. For visual clarity, the red attractive patch in the β-form is depicted spanning the whole length of the spherocylinder body.

