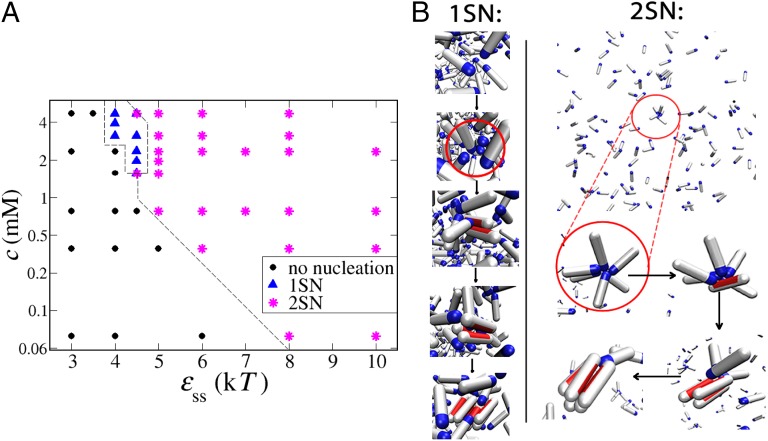
Fig. 2.
Mechanism of amyloid nucleation. (A) Tentative phase diagram. At low concentrations and low interpeptide interactions, no nucleation was observed (black circles). The one-step mechanism is possible only at low interpeptide interactions and high concentrations (blue triangles). In any other case, the nucleation proceeded through the two-step mechanism (magenta asterisks). All points are collected for . The dashed line is a guide to the eye. (B) Pre- and postnucleation snapshots for two points in the phase diagram. (Left) The 1SN case: and . The red circle zooms into the area where nucleation happens. (Right) The 2SN case at low peptide concentration: and . The nucleating oligomer is circled in red in the first snapshot and magnified in the rest of the snapshots.

