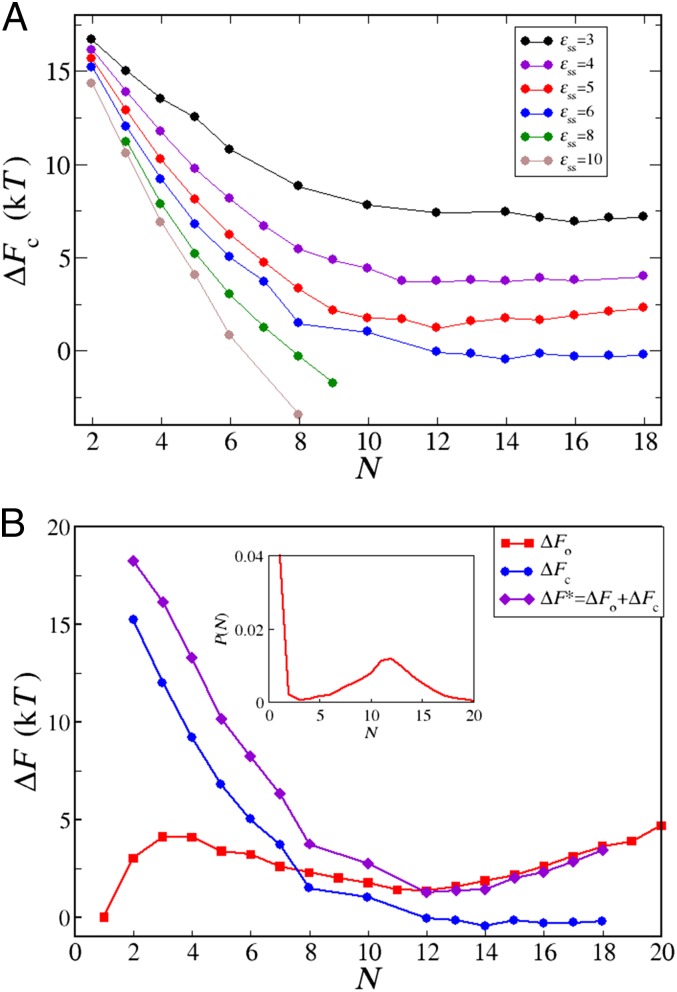
Fig. 3.
(A) The free energy barrier for conversion of one random coil peptide into the β-form within a disordered oligomer of the size N for various values of interpeptide interaction. From top to bottom, . In all cases, . (B) Partition of the free energy barrier for nucleation from solution. The red line and red squares show free energy for oligomerization, , obtained from the oligomer size distribution (shown in Inset) at mM and . The blue line and blue circles show free energy for conversion of one peptide into the β-prone state within an oligomer of size N, , for and . Note that the blue line in B corresponds to the blue line in A. The violet line and violet diamonds show the free energy barrier for formation of a critical nucleus from solution, , at mM and obtained as .

