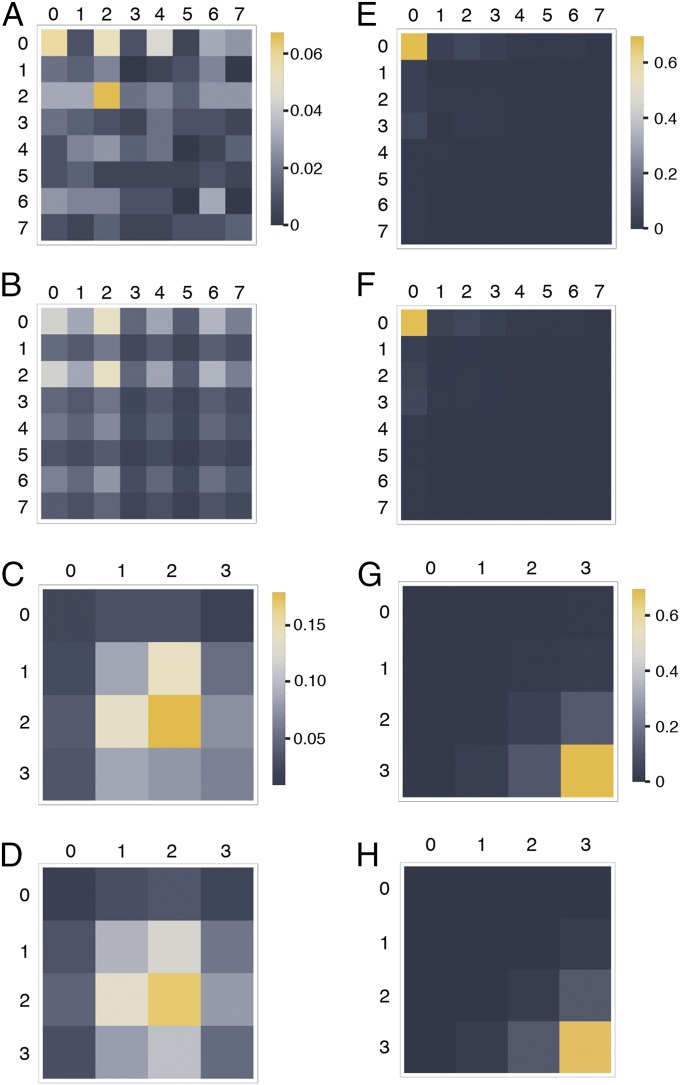
Fig. 4.
Joint probability distributions. (A) Observed joint probabilities [relative frequencies; ] for nucleosome configuration i at the 5′ promoter (rows) and nucleosome configuration j at the 3′ promoter (columns) of activated (A) gene molecules () (Fig. 1A). (B) Predicted joint distribution on the assumption of stochastic independence [i.e., ]. (C) Observed joint probabilities [] for the numbers of nucleosomes at the 5′ (rows) and 3′ (columns) promoters of induced gene molecules. (D) Joint probabilities [] predicted on the assumption of stochastic independence. (E–H) Equivalent to A–D, respectively, for repressed gene molecules; 223 and 233 molecules were analyzed for the induced and noninduced genes, respectively.

