Fig. 5.
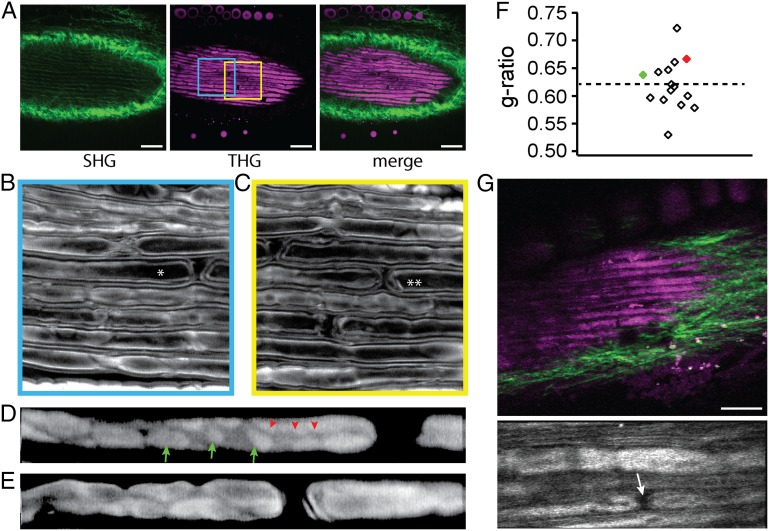
Imaging-intact murine sciatic nerves ex vivo and in vivo. (A) Simultaneous SHG and THG imaging of ex vivo tissue. (Scale bar, 50 µm.) (B and C) Regions corresponding to the colored frames in A. The axons marked by asterisk (*) and double asterisks (**) are shown at higher magnification in D and E, respectively, focused at the level of the abaxonal membrane. Cajal bands (red arrowheads) and appositions (green arrows) are visible. The images of D and E are displayed on logarithmic intensity scales for easier identification. (F) The g-ratio of the fibers shown in B and C. Red and green points correspond to the marked fibers in B and C, respectively. (G) Imaging of in vivo tissue. (Scale bar, 30 μm.) (Lower) High-magnification view containing a node (arrow).

