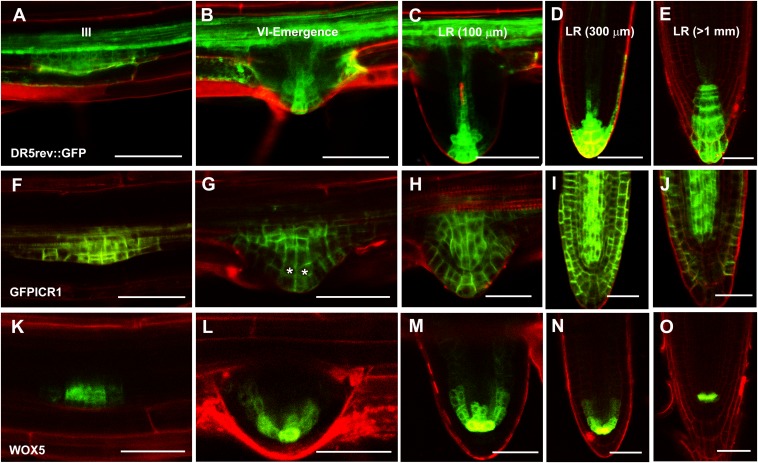
Fig. 3.
Decay of GFP-ICR1 in developing LRs. (A–E) The auxin response marker DR5rev::GFP, (F–J) GFP-ICR1, and (K–O) the QC marker pWOX5::GFPER during LR development starting from stage III (the LR developmental stages noted in A–E correspond to F–O as well). Note that changes in GFP-ICR1 levels correspond to auxin accumulation at the root tip. Asterisks in G highlight the cells with reduced GFP-ICR1 levels. LR developmental states were determined according to the work by Malamy and Benfey (41). (Scale bars: 50 μm.)

