
Figure 1.
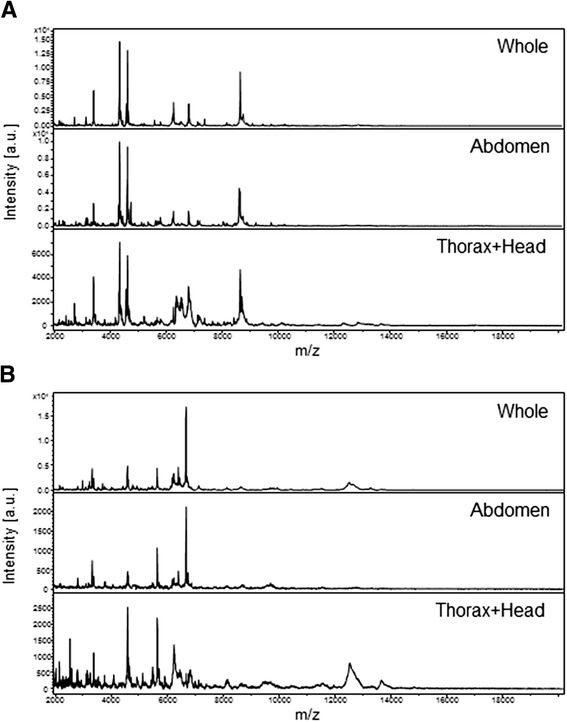
Comparison of MALDI-TOF MS spectra of whole specimens or body parts of mosquitoes at the L3 stage ranging from 2 to 20 kDa. Representative spectra from biological replicates performed in quadruplicate of whole (top-spectra), abdomen (middle-spectra) and thorax + head (bottom- spectra) body parts from An. gambiae specimens (A) and Ae. albopictus (B) are shown. The mosquito body parts are indicated in the right corner of each protein profile spectrum. a.u., arbitrary units; m/z, mass-to-charge ratio.