
Figure 3.
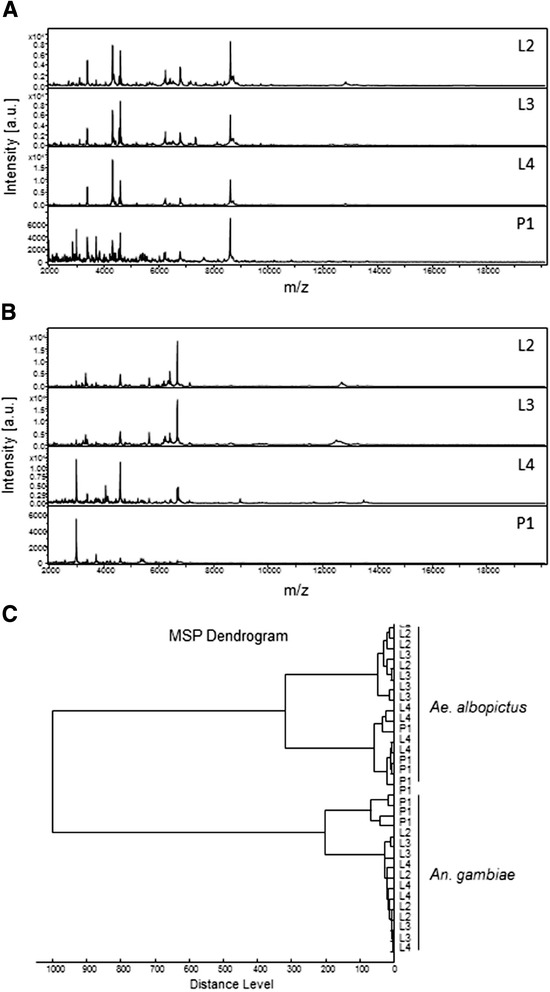
MALDI-TOF MS spectra of whole mosquitoes at different aquatic stages ranging from 2 to 20 kDa. A representative spectra from biological replicates performed in quadruplicate of each aquatic developmental stage of An. gambiae (A) and Ae.albopictus (B) specimens is shown. The mosquito life stages are indicated in the right corner of each protein profile spectrum. a.u., arbitrary units; m/z, mass-to-charge ratio; L2 to L4, larval stages 1 to 4; P1, pupae at day 1. (C) Dendrogram of MALDI-TOF MS spectra of different life stages of An. gambiae and Ae. albopictus. Each life stage is represented by 2 distinct specimens. Distance unit correspond to the relative similarity calculated from the distance matrix.