. 2014 Dec 4;3:e04380. doi: 10.7554/eLife.04380

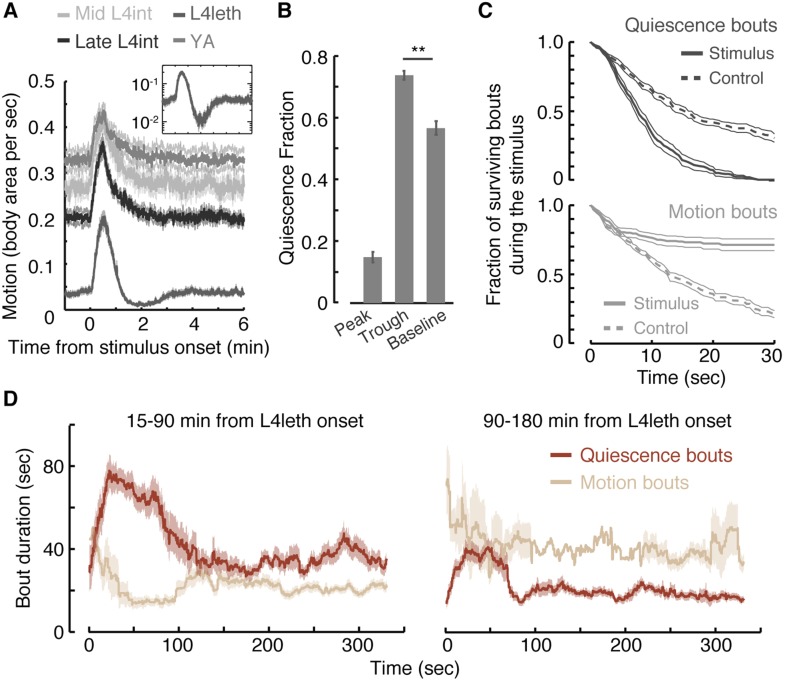
Figure 1. Motion plays a causal role in determining the duration of subsequent quiescence during lethargus.

(A) Wild-type animals at the mid L4int, late L4int, L4leth, and YA stages were exposed to 30 s light stimuli at an intensity of 20 mW/cm2. All stimuli were initiated at t = 0. Outside lethargus, locomotion monotonically decayed to baseline levels in 2 min. During lethargus, the peak in locomotion was followed by a trough prior to returning to baseline. Insets: the responses during lethargus shown on a semi-log scale. (B) The fractions of quiescence were calculated for 1 min intervals centered at the times of the peak and trough of the L4leth responses, as well as for their respective pre-stimulus baselines. Plots and bars depict mean ± s.e.m obtained from datasets of N = 40–50 animals per condition. Asterisks indicate p < 0.001. (C) Survival curves of quiescence and motion bouts of wild-type animals exposed to a 30 s, 20 mW/cm2, blue light stimulus during the first hour of L4leth. Bouts were identified using the frame subtraction method and control data were obtained from the same animals, but 8 min after the stimulus (non-stimulated control animals were also assayed, analyzed the same way, and found to be indistinguishable from this control group). Mean ± s.e.m, N > 200 bouts for each condition. (D) The dynamics of bouts obtained from a posture-based analysis following a 15 s, 20 mW/cm2, blue light stimulus. Left and right panels correspond to the first and second halves of L4leth, respectively. See also Figure 1—figure supplements 1–3. Plots depict mean ± s.e.m, smoothed using a 30 s running window average. N = 40 animals.

DOI: http://dx.doi.org/10.7554/eLife.04380.003

Figure 1.

Figure 1—figure supplement 1. Calibration of weak blue light stimuli.
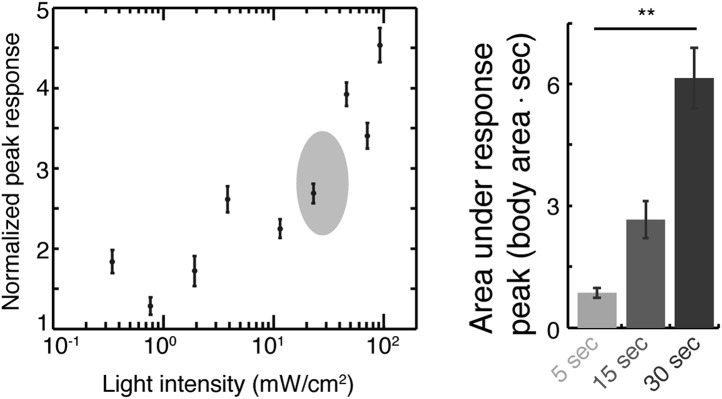
Figure 1—figure supplement 1.

Responses to blue light stimuli were defined as the peak value of overall motion, as measured using the frame subtraction method, normalized by the baseline average motion during a 1-min period prior to the stimulus. Left: L4int larvae were exposed to 15 s pulses of blue light at different intensities. Locomotion responses increased as a function of the light intensity in the 2–100 mW/cm2 range. The plot depicts mean ± s.e.m responses, N = 20–30 animals. Shaded area emphasizes the range of stimuli used throughout the rest of the manuscript. Right: the total amount of motion induced by the stimulus was defined as the area under the response peak. Three durations of a 20 mW/cm2 light stimulus were assayed (N > 200 trials per condition, error bars depict s.e.m, p < 0.001).
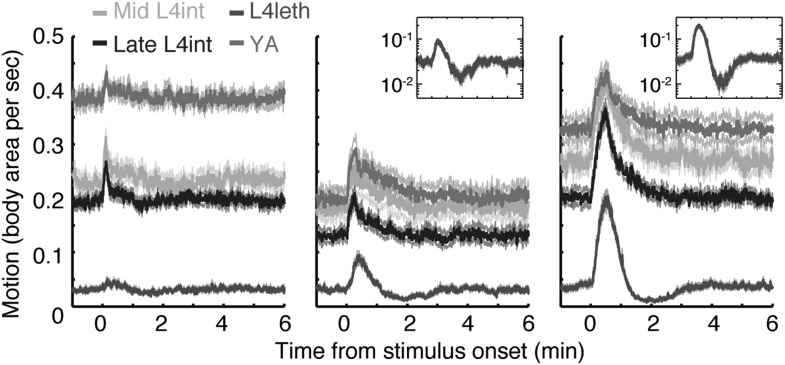
Figure 1—figure supplement 2. Responses to weak light stimuli.

Figure 1—figure supplement 2.

Wild-type animals at the mid L4int, late L4int, L4leth, and YA stages were exposed to 5 (left), 15 (middle), and 30 s (right) light stimuli at an intensity of 20 mW/cm2. All stimuli were initiated at t = 0. A sharp peak in locomotion in response to a 5 s stimulus was observed outside lethargus, but not during lethargus. Both 15 s and 30 s stimuli evoked a transient increase in locomotion. Outside lethargus, locomotion monotonically decayed to baseline levels in 2 min. In contrast, during lethargus the peak in locomotion was followed by a trough prior to returning to baseline. Insets: the responses during lethargus shown on a semi-log scale.
Figure 1—figure supplement 3. Responses during quiescence and motion.
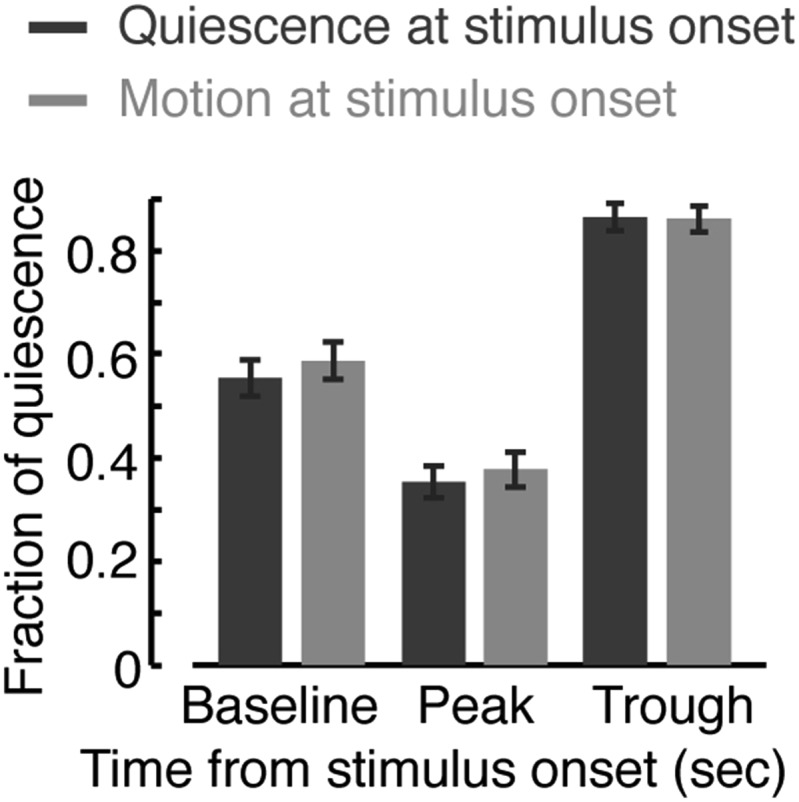
Figure 1—figure supplement 3.

The fraction of quiescence during 1 min intervals centered at a time point prior to the onset of the stimulus (baseline), at the peak of the locomotion response, and at the trough of the response. Dark or light bars correspond to data obtained from instances when the animals were quiescent or motile, respectively, at the time of the stimulus onset. Responses assayed using the frame subtraction method appeared indistinguishable based on the type of bout at the time of stimulus onset. Error bars depict s.e.m. Plots and bars in all panels depict mean ± s.e.m obtained from datasets of N = 40–50 animals per condition. Asterisks indicate p < 0.001.