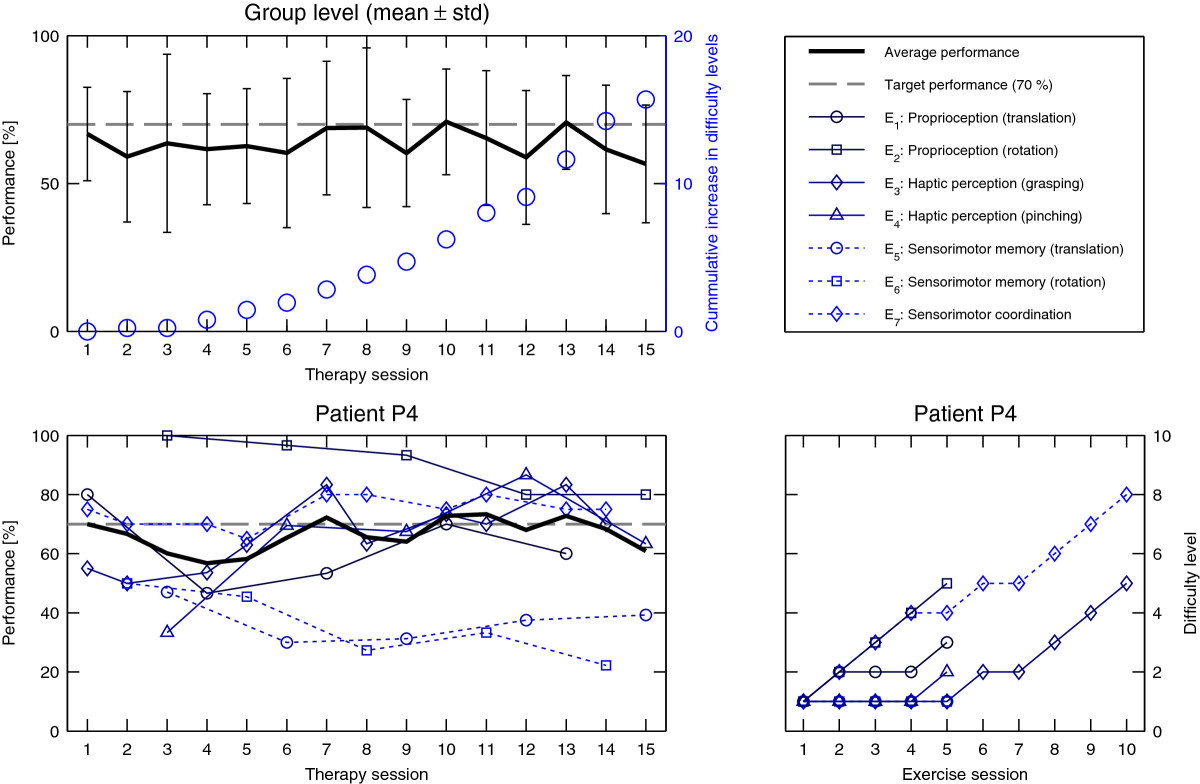
Figure 5.

Therapy exercise performance. Top: Average therapy session performance (mean and standard deviation over all patients) tracks the desired 70% level (left y-axis). During therapy progression, difficulty levels (averaged over all patients) continuously increase (right y-axis, blue circles). Bottom: Exercise-wise performance evolution and corresponding difficulty level adjustments for a representative patient (P4). Note that only a subset of 3 exercises was performed during each therapy session.
