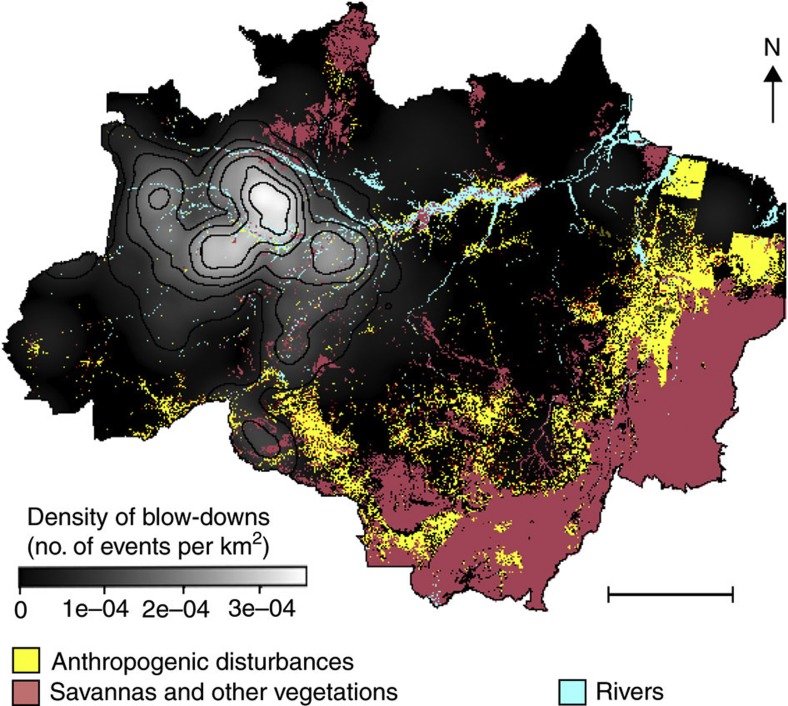
Figure 2. Spatial distribution of large disturbances in the Brazilian Amazon.
Cluster map of blow-downs of Brazilian Amazon using a Gaussian smoothing kernel28 with bandwidth of 200 km modelled from 330 large disturbances ≥30 ha detected in 137 Landsat images over the Amazon region26. Colour bar is the intensity of large disturbances in the Amazon (number of blow-downs per km2). Legend of scalebar for the map of blow-down density is 500 km.

