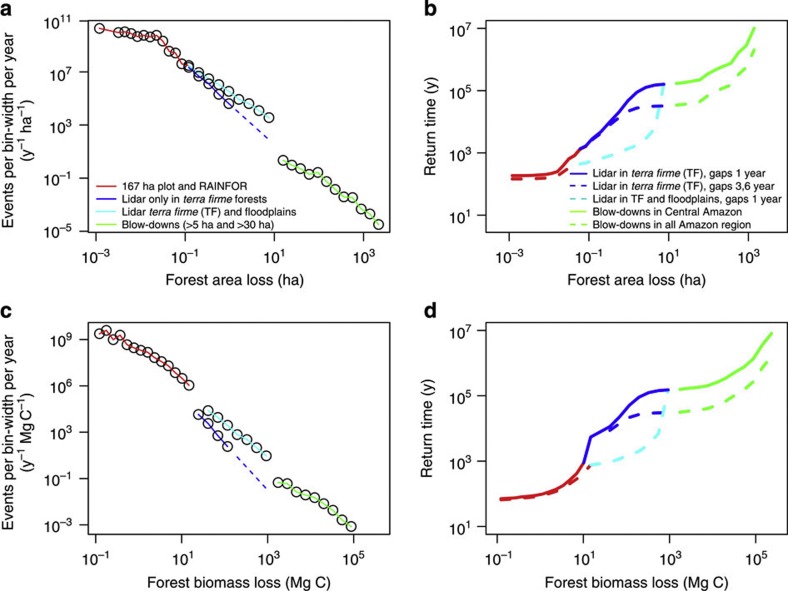
Figure 3. Estimated frequency distributions of natural forest disturbances in the Amazon.
(a) Number of disturbances per year obtained by scaling observed events to the full Amazon region by multiplication with the inverse of observed area fraction. Number density of disturbances per year obtained from a histogram and dividing the resulting numbers by histogram bin-width. Bin-widths are chosen such as to include at least one event; the number density follows approximately Δlog (number of occurrences)/Δlog (disturbance size)≈−2.5. (b) Return intervals versus severity of events calculated using the inverse of the cumulative PDF (see Methods) for various combinations of the data from repeated plot measurements, lidar surveys and Landsat imagery. For (a) and (b) largest blow-downs (those detected by Landsat imagery) are scaled to the region by multiplication of Amazon area fraction with large blow-downs. Panels (c) and (d) are similar to (a) and (b) but with respect to disturbance biomass loss instead of disturbance area. In (b,d) solid lines correspond to the case where large blow-downs are included only in the Central Amazon while the dashed lines correspond to the case where largest blow-downs are assumed to occur everywhere in the region (as a sensitivity study) and similarly the dashed light blue line corresponds to the case where also floodplain lidar data with river-driven disturbances are included (note that the forest plot network is based overwhelmingly on non-floodplain plots).

