Figure 3.

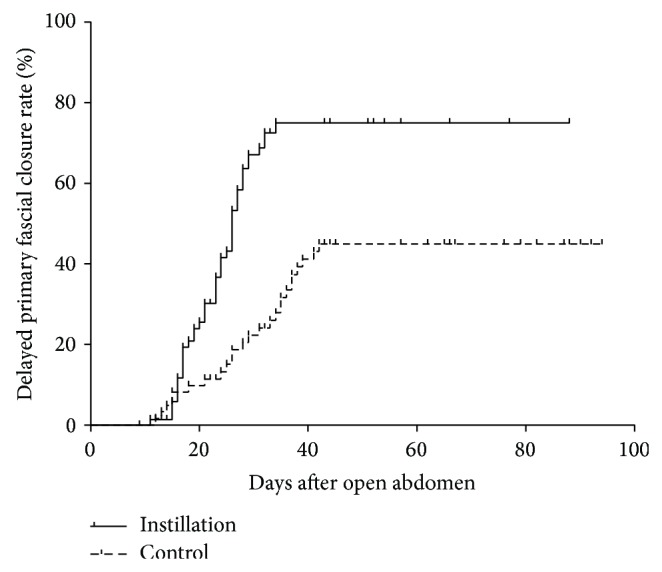
Delayed primary fascial closure rates in the two groups. The curves were calculated by Kaplan-Meier method and compared by log-rank test (P = 0.013).

Delayed primary fascial closure rates in the two groups. The curves were calculated by Kaplan-Meier method and compared by log-rank test (P = 0.013).