. 2014 Dec 18;11:E221. doi: 10.5888/pcd11.130369

Figure 1.

This figure consists of 4 graphs. The first graph shows 2 trends for all cancer sites among Alaska Native men and women: the annual percentage change (APC) for 1970–2004 was 1.10 (P < .05); the APC for 2004–2010 was −1.86. The second graph shows trends for breast cancer among Alaska Native women: the APC for 1970–1996 was 5.10 (P < .05); the APC for 1996–2010 was −0.32. The third graph shows trends for lung cancer among Alaska Native men and women: the APC for 1970–1984 was 7.17 (P <.05); the APC for 1984–2010 was 0.16. The fourth graph shows trends for colorectal cancer among Alaska Native men and women: the APC for 1970–1998 was 1.58 (P < .05); the APC for 1998–2010 was −2.59 (P < .05).

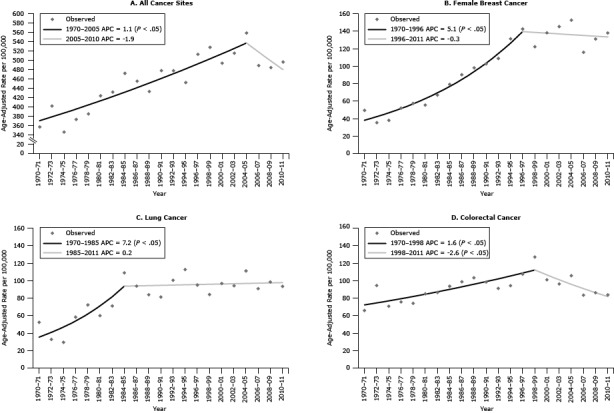
Joinpoint regression analysis to detect changes in incidence trends among Alaska Native people, 1970–2011. A, All cancer sites combined, men and women. B, Breast cancer, women. C, Lung cancer, men and women. D, Colorectal cancer, men and women. A P value <.05 indicates a significant annual percentage change (APC) in trend. Source: Alaska Native Tumor Registry.