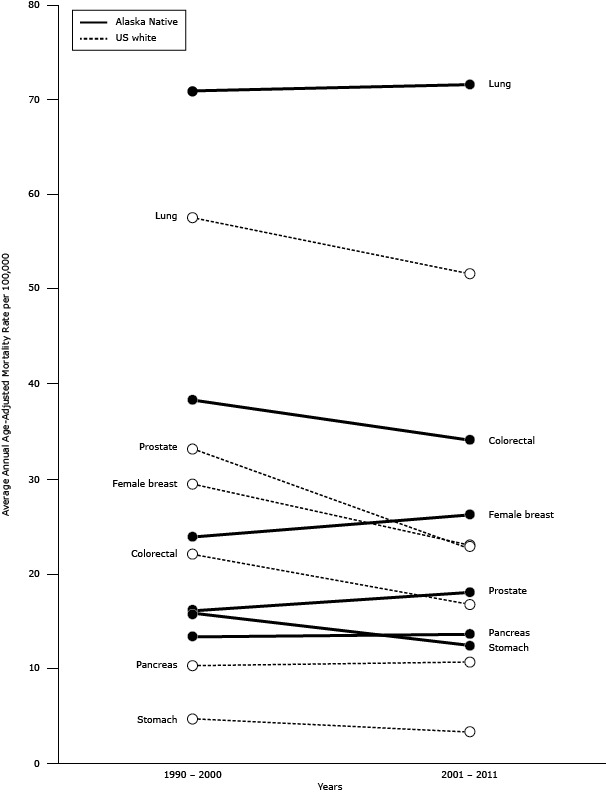
Figure 2.

Cancer mortality rates in Alaska Native and US white populations for 2 periods, 1990–2000 and 2001–2011.
| Cancer Site | Race | 1990–2000 | 2001–2011 |
|---|---|---|---|
| Lung | Alaska Native | 71.0 | 71.6 |
| US white | 57.5 | 51.7 | |
| Colorectal | Alaska Native | 38.3 | 34.1 |
| US white | 22.0 | 16.8 | |
| Female breast | Alaska Native | 23.9 | 26.2 |
| US white | 29.4 | 23.0 | |
| Prostate | Alaska Native | 16.1 | 18.0 |
| US white | 33.1 | 22.7 | |
| Pancreas | Alaska Native | 13.3 | 13.6 |
| US white | 10.3 | 10.6 | |
| Stomach | Alaska Native | 15.8 | 12.5 |
| US white | 4.7 | 3.3 |
