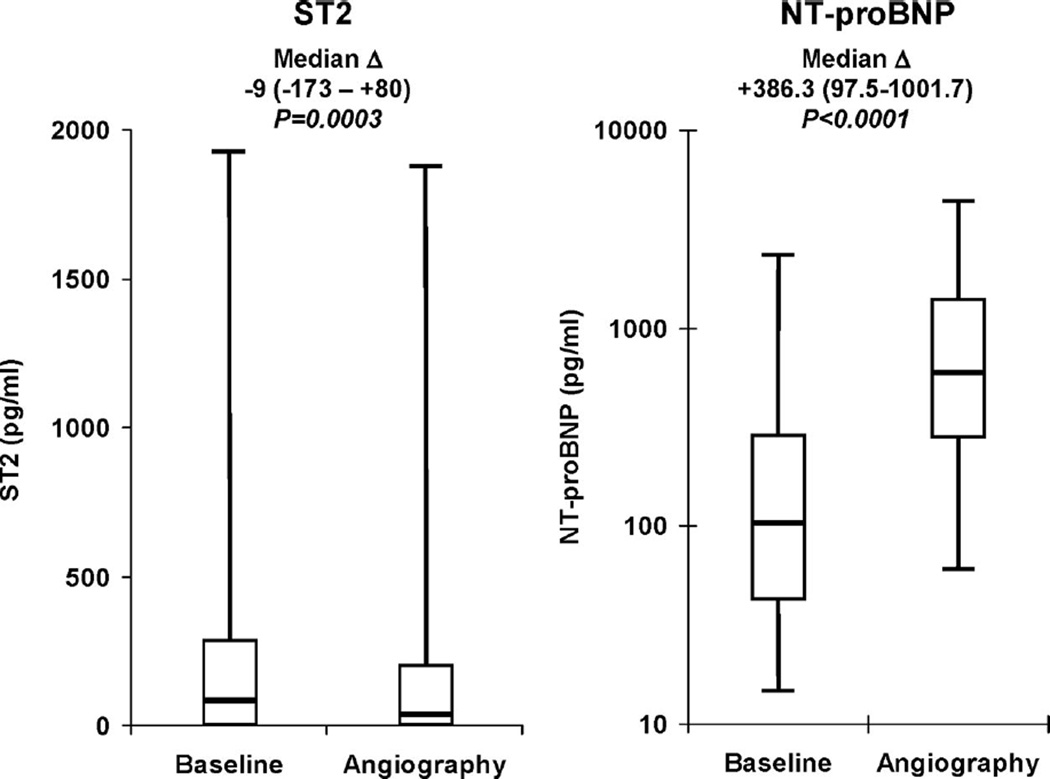
Figure 1.
Baseline and angiography levels of ST2 and NT-proBNP. Analyses were restricted to patients in whom measurements were available at both time points. NT-proBNP levels are plotted on a logarithmic scale. The median difference (Δ) and IQR for levels of each biomarker between the 2 time points are shown above the boxes. The bottom and top whiskers indicate the 5th and 95th percentile levels; the lower and upper boundaries of the boxes, the 25th and 75th percentile levels; and the horizontal line within the box, the median level.

