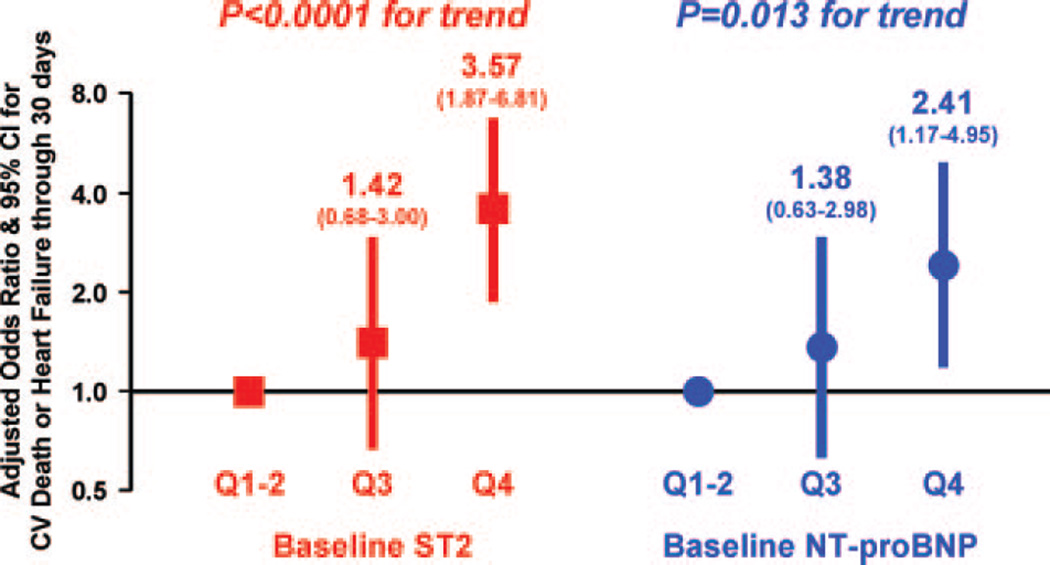
Figure 4.
Multivariable-adjusted multimarker analysis of the association between baseline biomarker levels and cardiovascular (CV) death and heart failure. Adjusted ORs for cardiovascular death or heart failure through 30 days are depicted with red squares for ST2 quartiles and blue circles for NT-proBNP quartiles; vertical bars denote 95% CIs. The regression model included both biomarkers and age, sex, hypertension, diabetes mellitus, prior MI, prior CHF, creatinine clearance, infarct location, Killip class, time from symptom onset to lytic, type of lytic, and peak CK.

