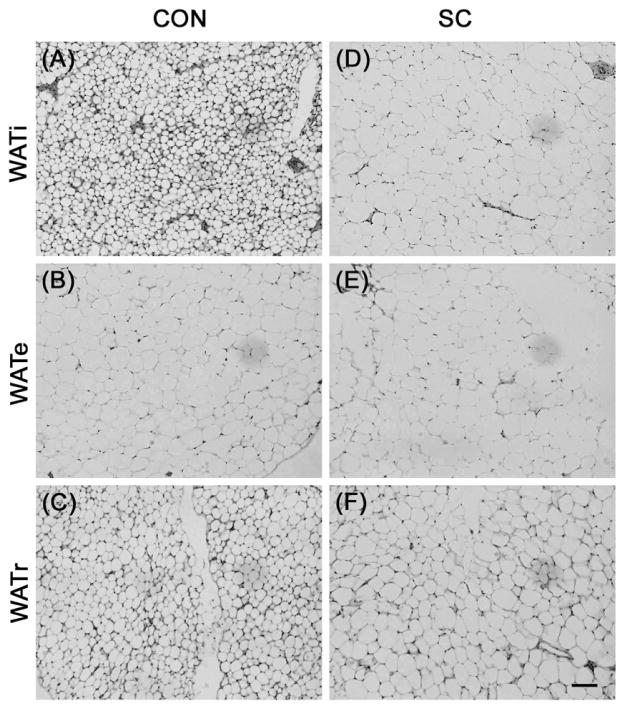
Figure 4.
Representative sections of H&E stained adipose tissue showing WATi and WATr adipocytes were enlarged in SC mice (D and F, respectively) compared to control C57BL/6 mice (A and C, respectively). In contrast, WATe adipocytes were comparable in size between the two groups (B and E). Scale bar = 100 μm.

