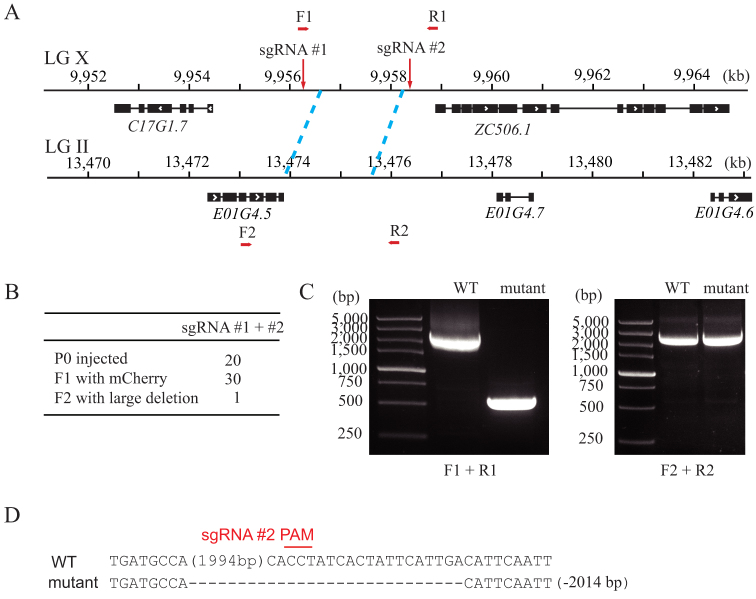
Figure 3. Dual sgRNA-guided deletion of a repetitive sequence.
(A) Schematic of gene structure. (B) Summary of the microinjection experiments. F2 progenies were directly screened by PCR amplification. (C) PCR amplification of the targeted region (left panel) and its homologous region (right panel). (D) Sequence alignment of wild-type and mutant animals. Dash indicates deletion. The number in parentheses represents the number of bases not shown. The number of deleted (−) bases is indicated on the right side.

